
Descrizione
Indicatore Fair Value Gap
Panoramica
L'indicatore Fair Value Gap è uno strumento di precisione per i trader price-action che vogliono identificare, monitorare e convalidare gli squilibri di mercato a breve termine. Rileva automaticamente i Fair Value Gap (FVG) rialzisti e ribassisti, evidenzia le zone attive (non mitigate) sul tuo grafico e registra quando il prezzo successivamente riempie (mitiga) quelle zone. Leggero e non repainting (opera su barre chiuse), questo indicatore è progettato per un'analisi affidabile nel trading live e nel backtesting.
Caratteristiche principali
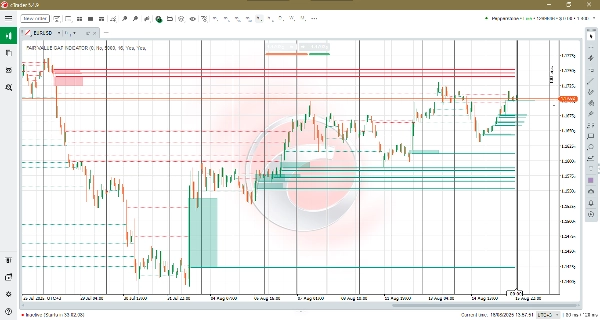
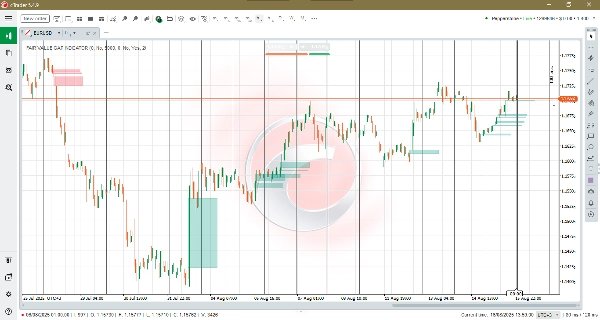
- Rilevamento FVG automatizzato: Una logica robusta a 3 barre identifica sia le zone di squilibrio rialziste che ribassiste e traccia zone rettangolari pulite sul grafico.
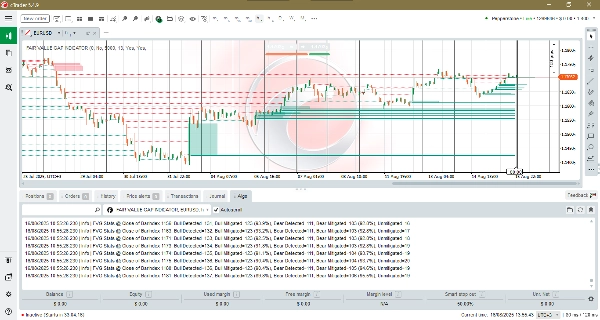
- Tracciamento della mitigazione: Quando il prezzo chiude attraverso una zona, l'indicatore rimuove il riquadro e può disegnare una linea tratteggiata persistente di mitigazione per riferimento storico.
- Sovrapposizione dei livelli non mitigati: Mostra i N livelli non riempiti più recenti come linee orizzontali in grassetto disegnate dalla barra di rilevamento alla barra attualmente in formazione. Questo rende facile scansionare visivamente i Fair Value Gap attivi (non mitigati) e identificare rapidamente i loro livelli di prezzo.
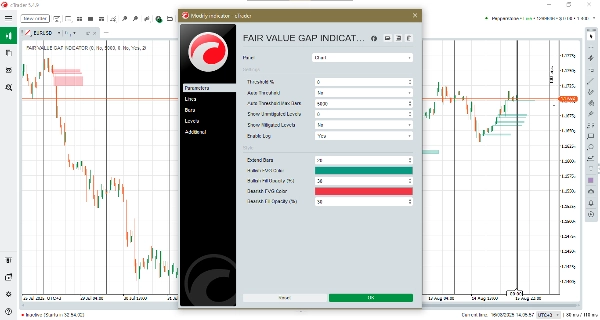
- Soglie manuali e automatiche: Scegli una soglia relativa fissa o abilita la Soglia Automatica per permettere all'indicatore di adattarsi all'attività di mercato recente.
- Barre massime per soglia automatica: Controlla la dimensione della finestra mobile usata per calcolare la soglia automatica. Valori più grandi rendono la soglia più stabile (stabile su una storia più lunga); valori più piccoli la rendono più reattiva alla volatilità recente.
- Visual personalizzati e proiezione: Imposta la lunghezza di estensione (quanto lontano proiettano le caselle), il colore e l'opacità di riempimento per le zone rialziste e ribassiste per adattarle allo stile del tuo grafico.
- Registrazione nel terminale: Linee di log compatte riportano il totale degli FVG rilevati, le mitigazioni e i conteggi attuali non mitigati—ideale per la convalida e la messa a punto della strategia.
- Logica su barre chiuse: Progettato per funzionare una volta per ogni barra chiusa per minimizzare il repainting.
Vantaggi
- Riferimenti chiari per il trading: Trova rapidamente le zone di squilibrio che possono agire come obiettivi di ritorno, aree di reazione o riferimenti per la gestione del trade.
- Convalida e statistiche: Usa i log del terminale e le percentuali di mitigazione per convalidare i segnali e regolare la sensibilità della tua strategia.
- Sensibilità adattabile: La Soglia Automatica + Barre Massime permette all'indicatore di comportarsi in modo affidabile in mercati tranquilli e volatili senza continue regolazioni manuali.
- Visual compatti e non invasivi: L'impronta visiva minima mantiene i tuoi grafici leggibili preservando il contesto essenziale.
Ideale per
Trader giornalieri, swing trader e scalper che si affidano al price-action e ai concetti di squilibrio, oltre ad analisti che convalidano le reazioni del flusso ordini e le performance della strategia.
Conclusione
L'indicatore Fair Value Gap combina una rilevazione precisa degli squilibri con analisi di mitigazione e soglie adattative, offrendoti una visione focalizzata e a basso rumore degli squilibri di mercato. Usalo per individuare potenziali ritorni di prezzo, gestire i trade in modo più intelligente e misurare con quale frequenza le zone vengono riempite nel tuo mercato.
Riepilogo
Key features include automated FVG detection, mitigation tracking, and an overlay showing recent unmitigated levels as bold horizontal lines for easy visual scanning. Users can select manual or automatic thresholding to adapt sensitivity to market conditions, with adjustable parameters controlling the responsiveness of the auto threshold. Customizable visual settings allow traders to tailor the appearance of bullish and bearish zones.
The indicator operates on closed bars to minimize repainting, ensuring reliable signals for live trading and backtesting. Terminal logging provides concise statistics on detected gaps and mitigations, aiding validation and strategy tuning.
Suitable for day traders, swing traders, scalpers, and analysts, the Fair Value Gap Indicator supports markets including Forex, indices, commodities, cryptocurrencies, and stocks. It offers a focused, low-noise view of market imbalances to assist in identifying potential price return targets and managing trades.
Recensioni dei clienti
5 | 100 % | |
4 | 0 % | |
3 | 0 % | |
2 | 0 % | |
1 | 0 % |


