
Descrizione
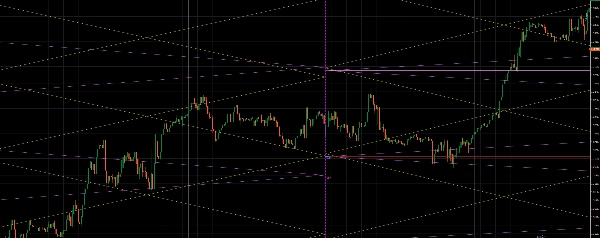
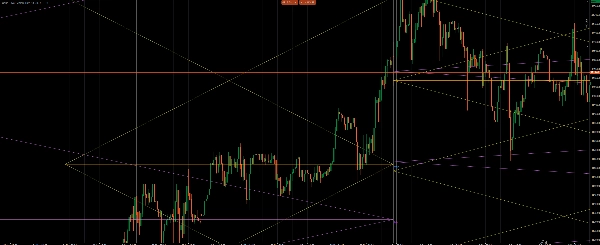
Gann Pivot Vision è uno strumento analitico innovativo che combina i classici livelli di inversione pivot e la geometria di Gann, permettendo ai trader di identificare visivamente i principali livelli di supporto/resistenza e prevedere con alta precisione le inversioni di mercato.
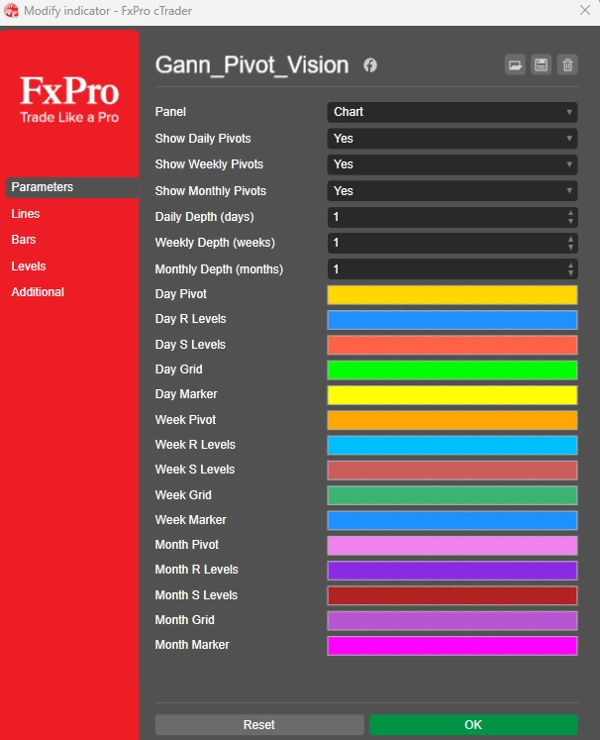
L'indicatore costruisce automaticamente:
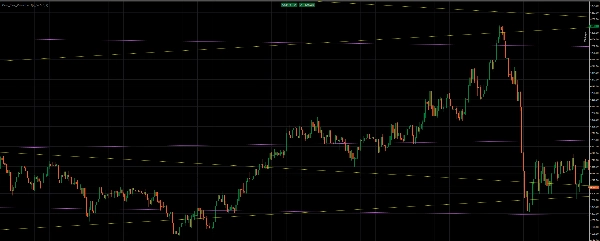
✔ Livelli Pivot Giornalieri
✔ Livelli Pivot Settimanali
✔ Livelli Pivot Mensili
Ogni intervallo temporale è visualizzato con una propria combinazione di colori e può essere abilitato o disabilitato se necessario.
🔷 Griglia Gann e struttura diagonale
Inoltre, lo strumento genera una griglia Gann a forma di diamante basata sull'intervallo del periodo precedente.:
◾ Linee diagonali (simmetria di Gann)
◾ Intersezioni geometriche — aree di reazioni chiave del mercato
◾ Centro della struttura = il prezzo centrale del periodo (Punto Pivot)
Questa combinazione consente di:
🔹 identificare forti cluster di prezzo
🔹 identificare aree di probabile inversione
🔹 confermare segnali di trend e controtrend
Riepilogo
Recensioni dei clienti
5 | 0 % | |
4 | 100 % | |
3 | 0 % | |
2 | 0 % | |
1 | 0 % |


![Logo di "Gaussian Channel [Iridio Capital]"](https://cdn.ctrader.com/image/webp/7c039209-5573-4a54-a072-f9528b503103_41960)


