
Descrizione
Il Wyckoff Schematic Indicator è uno strumento professionale per la struttura del mercato progettato per rilevare e visualizzare automaticamente le fasi di accumulo e distribuzione di Wyckoff direttamente sul grafico.
Basato sui principi del Metodo Wyckoff, questo indicatore identifica eventi istituzionali chiave come Selling Climax (SC), Automatic Rally (AR), Spring, Sign of Strength (SOS), Buying Climax (BC), Upthrust (UTAD) e altro ancora—aiutando i trader a comprendere il comportamento del denaro intelligente in tempo reale.
A differenza degli indicatori tradizionali, questo strumento non si basa su segnali ritardati ma si concentra invece su struttura dei prezzi, comportamento del volume e volatilità, fornendo una comprensione più profonda delle dinamiche di mercato.
Concetto Fondamentale
L'indicatore si basa sull'idea che i mercati si muovono attraverso cicli strutturati:
- Accumulo → Rialzo → Distribuzione → Ribasso
Rileva e visualizza automaticamente:
- Intervalli di mercato (ranges)
- Fasi di Wyckoff (A–E)
- Eventi istituzionali chiave
- Rotture strutturali e falsi segnali (breakouts e fakeouts)
Caratteristiche Principali
1. Rilevamento Automatico delle Fasi di Wyckoff
L'indicatore identifica tutte le fasi principali del ciclo di Wyckoff:
- Fase A – Interruzione del trend
- Fase B – Costruzione di una causa (formazione del range)
- Fase C – Spring / UTAD (falso breakout)
- Fase D – Conferma del trend (SOS / SOW)
- Fase E – Continuazione del trend
Ogni fase è evidenziata visivamente con colori personalizzabili per un riconoscimento immediato.
2. Riconoscimento Intelligente degli Eventi
Il sistema rileva eventi critici di Wyckoff:
Accumulo:
- SC – Selling Climax
- AR – Automatic Rally
- ST – Secondary Test
- Spring – Falso breakdown
- SOS – Segnale di forza
- LPS – Ultimo punto di supporto
Distribuzione:
- BC – Buying Climax
- AR – Automatic Reaction
- ST – Secondary Test
- UTAD – Upthrust After Distribution
- SOW – Segnale di debolezza
- LPSY – Ultimo punto di offerta
Questi eventi sono tracciati direttamente sul grafico con etichette.
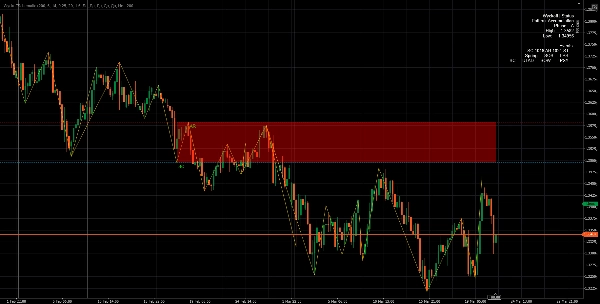
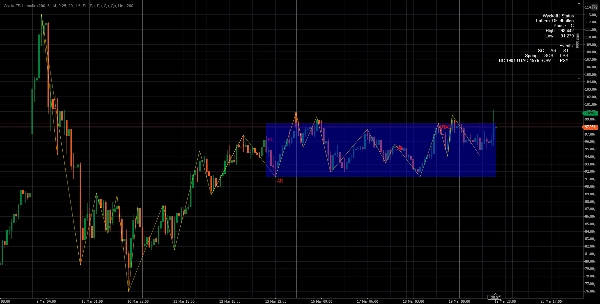
3. Rilevamento Adattivo del Range
L'indicatore costruisce e aggiorna dinamicamente i range di trading:
- Rileva automaticamente massimi e minimi del range
- Regola i confini utilizzando tolleranza basata su ATR
- Mostra zone di supporto e resistenza
Questo permette ai trader di vedere chiaramente dove il mercato sta accumulando o distribuendo.
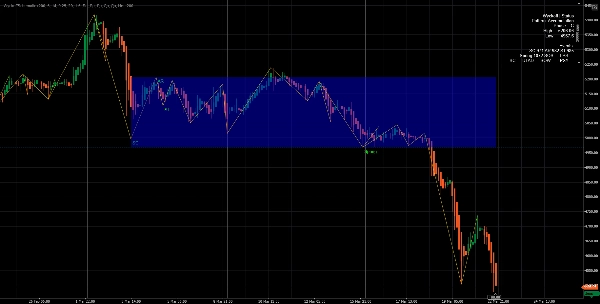
4. Motore di Struttura ZigZag
Un sistema ZigZag basato su pivot integrato:
- Filtra il rumore di mercato
- Evidenzia veri massimi e minimi strutturali
- Garantisce un riconoscimento accurato dei pattern
Questo è essenziale per identificare in modo affidabile le strutture di Wyckoff.
5. Integrazione di Volume e Volatilità
L'indicatore utilizza:
- Media Mobile del Volume
- Rilevamento di picchi di volume
- ATR (Average True Range)
Questo gli permette di:
- Confermare l'attività istituzionale
- Filtrare segnali falsi
- Migliorare l'accuratezza di eventi come SC, BC, Spring, UTAD
6. Logica a Macchina a Stati in Tempo Reale
Alla base, l'indicatore esegue un algoritmo a macchina a stati che:
- Traccia l'evoluzione della struttura di mercato
- Transizioni tra le fasi (A → E)
- Previene segnali duplicati
- Mantiene il contesto (Accumulo vs Distribuzione)
7. Componenti Visivi
L'indicatore fornisce un set completo di strumenti visivi:
- ✔ Riquadri evidenziatori delle fasi
- ✔ Linee di massimo/minimo del range
- ✔ Linee di struttura ZigZag
- ✔ Etichette degli eventi sul grafico
- ✔ Pannello di stato in tempo reale
8. Pannello di Stato (Insight di Mercato in Diretta)
Un pannello integrato mostra:
- Pattern corrente (Accumulo / Distribuzione)
- Fase corrente (A–E)
- Confini del range
- Eventi rilevati
Questo offre ai trader una panoramica immediata delle condizioni di mercato.
9. Sistema di Allerta
Opzionali avvisi popup ti notificano quando si verificano eventi chiave:
- SC, BC, Spring, UTAD, SOS, SOW, ecc.
Perfetto per monitorare più mercati.
Vantaggi
✔ Prospettiva del Denaro Intelligente
A differenza degli indicatori comuni, questo strumento segue la logica istituzionale, non gli indicatori retail.
✔ Rilevamento Precoce dei Segnali
Identifica accumulo/distribuzione prima delle rotture, permettendo:
- Ingressi anticipati
- Setup rischio/ricompensa migliori
✔ Riduzione del Rumore
Utilizzando pivot, ATR e filtri di volume, l'indicatore evita:
- Segnali casuali
- Rumore di mercato
- Falsi breakout
✔ Analisi Wyckoff Completamente Automatica
Non è necessario segnare manualmente:
- Fasi
- Eventi
- Intervalli
Tutto viene rilevato automaticamente.
✔ Altamente Personalizzabile
Puoi regolare:
- Periodo di lookback
- Sensibilità del pivot
- Tolleranza ATR
- Sensibilità del volume
- Elementi visivi (etichette, riquadri, linee)
✔ Ottimizzato per le Prestazioni
- Utilizza analisi a finestra scorrevole
- Limita gli oggetti di disegno
- Efficiente per il trading in tempo reale
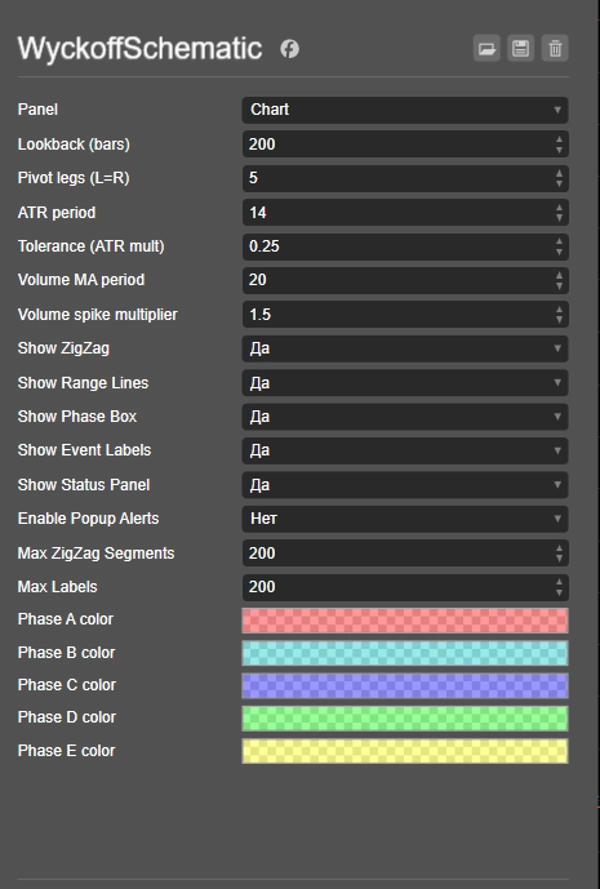
Parametri di Input
Struttura e Sensibilità
- Barre di Lookback – intervallo di analisi
- Gambe del Pivot – sensibilità al rilevamento degli swing
Volatilità e Tolleranza
- Periodo ATR
- Moltiplicatore ATR (Tolleranza)
Analisi del Volume
- Periodo MA del Volume
- Moltiplicatore di picco del volume
Visualizzazione
- Mostra ZigZag
- Mostra linee del range
- Mostra riquadro della fase
- Mostra etichette degli eventi
- Mostra pannello di stato
Allarmi
- Abilita notifiche popup
Come Funziona (Semplificato)
- Rileva massimi/minimi pivot (struttura di mercato)
- Determina il contesto del trend (rialzista / ribassista)
- Cerca picchi di volume + condizioni strutturali
- Inizializza il pattern Wyckoff (Accumulo/Distribuzione)
- Traccia eventi e fasi passo dopo passo
- Aggiorna le visualizzazioni del grafico in tempo reale
Migliori Casi d'Uso
- Trading con denaro intelligente / Wyckoff
- Trading di breakout
- Trading in range
- Rilevamento di inversioni
- Analisi del flusso di ordini istituzionali
Conclusione
Il Wyckoff Schematic Indicator è uno strumento analitico potente che trasforma la complessa teoria di Wyckoff in un sistema di trading completamente automatizzato, visivo e operativo.
Permette ai trader di:
- Comprendere l'intento del mercato
- Identificare setup ad alta probabilità
- Operare in linea con il comportamento istituzionale
Riepilogo
Recensioni dei clienti
5 | 100 % | |
4 | 0 % | |
3 | 0 % | |
2 | 0 % | |
1 | 0 % |


