
Penerangan
Gann Pivot Vision adalah alat analisis inovatif yang menggabungkan tahap pembalikan pivot klasik dan geometri Gann, membolehkan pedagang mengenal pasti tahap sokongan/rintangan utama secara visual dan meramalkan pembalikan pasaran dengan ketepatan tinggi.
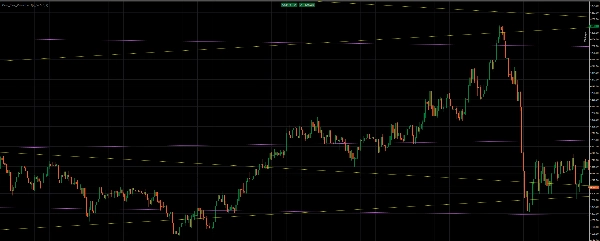
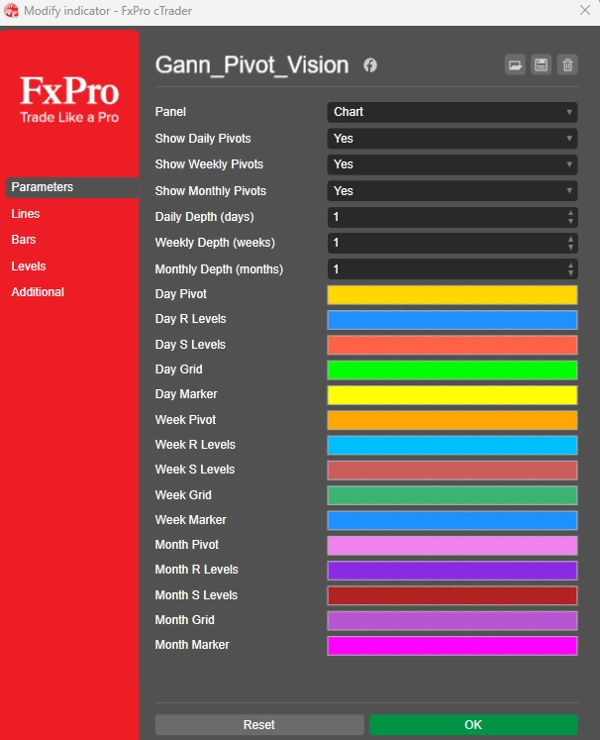
Penunjuk secara automatik membina:
✔ Tahap Pivot Harian
✔ Tahap Pivot Mingguan
✔ Tahap Pivot Bulanan
Setiap jangka masa dipaparkan dengan skim warna tersendiri dan boleh diaktifkan atau dinyahaktifkan jika perlu.
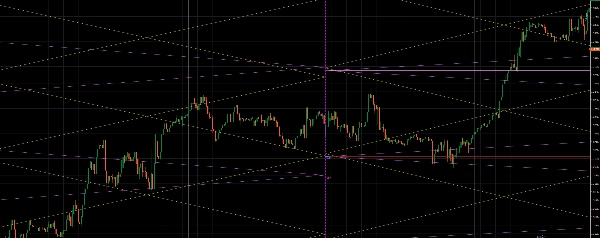
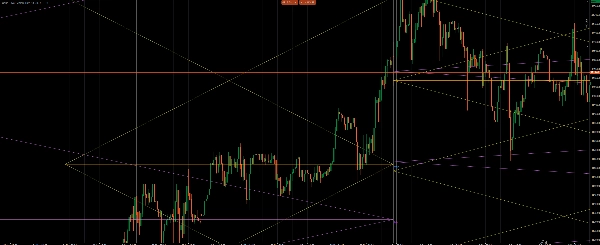
🔷 Rangka Gann dan struktur diagonal
Selain itu, alat ini menghasilkan rangka Gann berlian berdasarkan julat tempoh sebelumnya.:
◾ Garis diagonal (simetri Gann)
◾ Persilangan geometri — kawasan tindak balas pasaran utama
◾ Pusat struktur = harga tengah tempoh (Pivot Point)
Gabungan ini membolehkan anda untuk:
🔹 mengenal pasti kelompok harga yang kuat
🔹 mengenal pasti kawasan pembalikan yang mungkin
🔹 mengesahkan isyarat tren dan lawan tren
Ringkasan
Ulasan pelanggan
5 | 0 % | |
4 | 100 % | |
3 | 0 % | |
2 | 0 % | |
1 | 0 % |


