

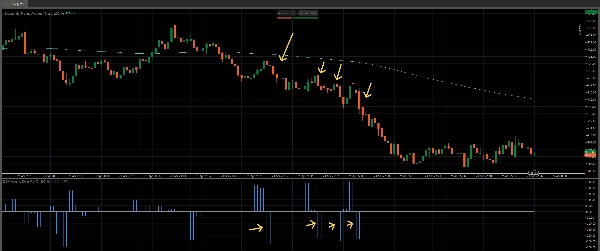
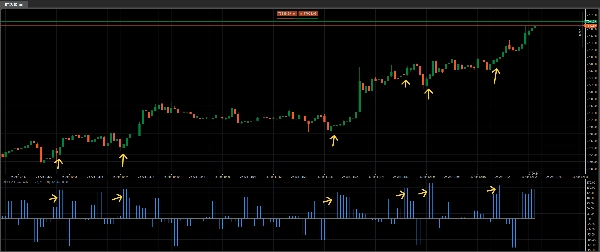
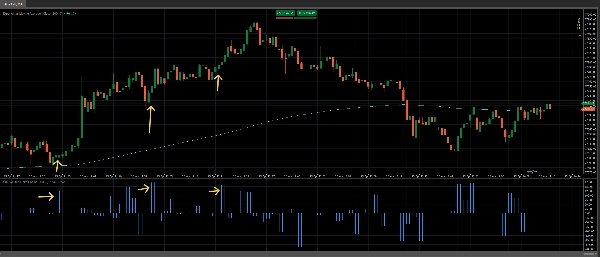
Açıklama
KISA BİR SÜRE İÇİN TÜM GÖSTERGELERİMİZ ŞİMDİ 19$
Bu tipik bir Hacim Delta Göstergesi değil. Bu, Level 2 DOM Hacim Delta Göstergesi — cTrader için Kurumsal Sınıf Emir Akışı. Kurumların Milyonlarca Ödediği Avantaj.
Her Perakende Tüccarın Karşılaştığı Problem. Bir mum yeşil kapanır. Hacim yüksektir. Siz alırsınız.
Fiyat anında tersine döner. Zarara kapılırsınız. Grafik size "yalan söyledi".
Yalan söylemedi — sadece mumun içindeki olanları göremediniz. O yüksek hacimli yeşil çubuk mu? O hacmin %70'i agresif satıştı. Kapanış, aralığın altındaki ince bir alım emirleri tabakası tarafından desteklendi. Kurumlar sizin alım emrinize dağıtım yapıyordu.
Standart hacim göstergeleri toplamı gösterir. Asla size kim kontrol ediyordu göstermez.
Hacim Delta bunu değiştirir. Hacim Delta Size Gerçekten Ne Gösterir
Hacim Delta her çubuğun hacmini alım hacmi ve satım hacmi olarak ayırır, sonra farkı hesaplar — delta. Pozitif delta alıcıların daha agresif olduğunu gösterir. Negatif delta satıcıların hakim olduğunu gösterir.
Bu, profesyonel tüccarları perakende tüccarlardan ayıran en önemli bilgi parçasıdır: ne kadar işlem yapıldığı değil, hangi tarafın daha agresif işlem yaptığıdır. Bu inançtır. Delta, her fiyat çubuğunun arkasındaki niyetin parmak izidir.
Ama burada durmaz
Bu gösterge tahmin yapmaz. Özel bir veri karışımında Level 2 Piyasa Derinliği verilerini okur — ekranda gördüğünüz fiyatın arkasındaki gerçek emir defteri.
Level 2 verisi (DOM — Piyasa Derinliği olarak da bilinir) her fiyat seviyesinde yığılmış gerçek alım ve satım emirlerini gösterir. Son işlem değil. Tahmin değil. Bankalar, hedge fonlar ve kurumsal masalardan brokerinizin likidite sağlayıcıları aracılığıyla akan gerçek bekleyen likidite.
Sonuç, alım ve satım hacmini sınıflandırmada %85-95 doğruluk seviyesidir — herhangi bir formül tabanlı yaklaşımdan çok daha yüksek.
Neden Önemli — Kurumların Sizin Görmediğiniz Şeyler
Goldman Sachs, Citadel, Jump Trading — hepsi emir akışı verisiyle işlem yapar. Alım ve satım baskısını gerçek zamanlı görürler. Absorpsiyonu görürler. Bir seviyenin savunulduğunu görürler. Delta fiyatla uyumsuz olduğunda görürler.
Bu altyapı için milyonlarca dolar öderler. Veri akışları, aynı yerde bulunan sunucular, özel araçlar.
Bu gösterge aynı temel konsepti cTrader grafiğinize getirir. Sulandırılmış bir versiyon değil. Brokerinizin likidite havuzundan gerçek Level 2 DOM verisi, profesyonel emir akışı tüccarlarının kullandığı aynı alım-satım sınıflandırmasına işlenmiş.
Bir perakende tüccar ile kurumsal tüccar arasındaki fark zeka değil. Bilgidir. Hacim Delta bu farkı kapatır.
Bu Kimler İçin
Gün içi tüccarlar gürültünün içinden görmek isteyenler. Bir mum yükseliş sinyali verir ama delta negatiftir, beklemeniz gerektiğini bilirsiniz. Bir mum zayıf görünür ama delta güçlü pozitifse, kurumların biriktirdiğini anlarsınız. Delta yalan söylemez — ne olduğunu gösterir, nasıl göründüğünü değil.
Skalperler şu anda hangi tarafın kontrolü elinde tuttuğunu bilmek isteyenler. Bir kırılmadaki delta sıçraması gerçek olduğunu doğrular. Düz delta ile kırılma, dönüş başlamadan önce bir tuzak olduğunu söyler.
Swing tüccarları uyum arayanlar. Delta uyumsuzlukları — fiyat yeni dip yapar ama delta yükseliyorsa — profesyonel ticarette en güvenilir dönüş sinyallerindendir. Bu gösterge bunları otomatik olarak tespit eder.
cTrader'da forex, endeks veya emtia işlemi yapan herkes ve Level 2 verisi sağlayan bir broker ile. Fusion Markets, IC Markets, Go Markets ve benzeri ECN/STP brokerlar bu göstergenin okuduğu DOM verisini sağlar.
Hiç "yüksek hacimli" bir mumun yanlış tarafında olduysanız, işte size nedenini söyleyen araç.
Ne Alırsınız
Grafiğinizin altında net deltayı gösteren temiz, profesyonel bir histogram, yüksek doğruluklu verilere dayanır. Pozitif çubuklar alıcıların hakim olduğunu gösterir. Negatif çubuklar satıcıların hakim olduğunu gösterir. Çubuğun büyüklüğü size ne kadar bir tarafın diğerinden üstün olduğunu gösterir.
Hiçbir karmaşa yok. Hacmin gecikmeli hareketli ortalamaları yok. Alım ve satımı "tahmin eden" renkli mumlar yok. Sadece agresif alım ile agresif satış arasındaki ham, filtrelenmemiş fark — perakende tüccarların erişebildiği en derin veri kaynağından hesaplanmış.
Bir bakışta delta çubuğu size on başka göstergenin tahmin etmeye çalıştığını söyler. Şimdi cTrader için edinin. Bu düşük fiyat için kaçırılmayacak bir fırsat.
Bu göstergenin kullanımı
- Gösterge üzerindeki en yüksek çubukların değerine bakarak en yüksek Hacim Delta Değerlerini belirleyin ve bu değeri göstergenin Hacim Delta alanına girin. Bu değer her parite ve zaman dilimi için farklıdır, bu yüzden işlem yaptığınız grafiğe göre bir kez ayarlanmalıdır
- Toplam Hacim değerini maksimum Hacim Delta değerinin 2 katı olarak ayarlayın. Böylece Hacim Delta, Toplam Hacim değerinin maksimum %50'si olur. Hacim Delta için iyi bir değer, Toplam Hacim'in %70-%80 arasıdır. Örnek: Toplam Hacim değeri 1000 ise, Hacim Delta = 700-800 arası
- Bu göstergesi, trendi belirlemek için 200 EMA veya VWAP ile birlikte kullanın ve sadece çizginin üzerindeki alımlara ve altındaki satımlara bakın
- İstenirse daha düzgün çubuk hareketi için opsiyonel çubuk toplamasını kullanın. Toplam Hacim ve Hacim Delta değerleri 2 toplanmış çubuk için 1 çubuktan daha büyük olacağından hacim değerlerini değiştirmeyi düşünün
Anahtar seviyelerde daha iyi bilgilendirilmiş kararlar için bunu Volume Profile Pro göstergemizle birleştirin: https://ctrader.com/products/4079
Muhteşem Black Box Bot'umuzu buradan görün: https://ctrader.com/products/3241
Özet
The indicator displays a clean histogram below the chart representing net volume delta per bar: positive bars indicate buyer dominance, negative bars indicate seller dominance, and bar size reflects the strength of that dominance. This provides traders with insight into market intent beyond total volume, revealing whether buyers or sellers controlled the price action.
It supports forex, indices, and commodities trading with brokers offering Level 2 data, such as Fusion Markets and IC Markets. Features include volume filtering and aggregated volume bars. The tool is suited for day traders, scalpers, and swing traders seeking to interpret order flow, confirm breakouts, detect divergences, and enhance decision-making with professional-level order flow data.
Tartışma
Müşteri değerlendirmeleri
5 | 50 % | |
4 | 50 % | |
3 | 0 % | |
2 | 0 % | |
1 | 0 % |












!["[Hamster-Coder] Moving Average MTF" logosu](https://cdn.ctrader.com/image/webp/b11b98b1-194d-4b8e-b00e-d611826ad159_31226)






