

present
가입하고 첫 구매 시 $50 할인을 받으세요
Trading product for Central Pivot Range 지표 Key Levels AI-assisted, image 1
Central Pivot Range
지표
버전 1.0, Aug 2026
Windows, Mac
Trading product for Central Pivot Range 지표 Key Levels AI-assisted, image 2
Trading product for Central Pivot Range 지표 Key Levels AI-assisted, image 3
Trading product for Central Pivot Range 지표 Key Levels AI-assisted, image 4
Trading product for Central Pivot Range 지표 Key Levels AI-assisted, image 5
Trading product for Central Pivot Range 지표 Key Levels AI-assisted, image 6
Trading product for Central Pivot Range 지표 Key Levels AI-assisted, image 7
가입일 07/05/2026
5
판매
63
무료 설치

설명

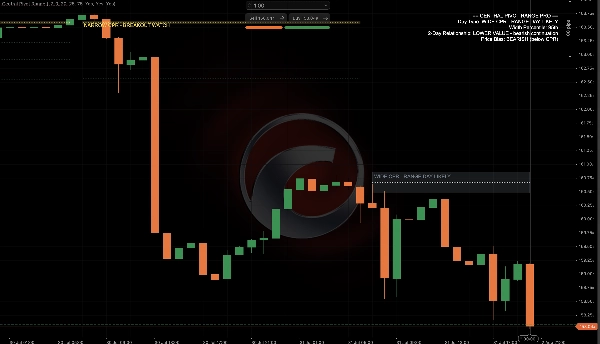
Central Pivot Range (CPR)은 전문 데이 트레이더들 사이에서 가장 널리 사용되는 일중 도구 중 하나이지만, 대부분의 CPR 지표는 단지 세 개의 선만 그리고 거기서 멈춥니다. Central Pivot Range Pro는 전문 트레이더들이 하루를 읽기 위해 실제로 사용하는 CPR 이론을 구현하여 *발생하기 전에* 단순한 레벨 자체뿐만 아니라 그 전의 상황을 읽을 수 있게 합니다.


**분석 내용:** 이전 세션의 고가, 저가, 종가를 사용하여 오늘의 피벗, 상부 중앙 피벗(TC), 하부 중앙 피벗(BC)을 구축한 후, 일반 CPR 플로터에는 없는 두 가지 통계적 해석을 추가합니다:


- **CPR 폭 백분위수** — 오늘의 CPR 폭이 최근 이력과 비교되어 순위가 매겨집니다. 좁은 CPR(하위 백분위수)은 통계적으로 추세 및 돌파일에 앞서며, 넓은 CPR(상위 백분위수)은 범위 내 횡보 및 변동성 높은 날에 앞섭니다. 이 지표는 세션이 시작되기 전에 어떤 상황인지 알려줍니다.

- **2일 CPR 관계** — 전문적인 전체 프레임워크를 사용하여 오늘의 CPR을 어제와 비교 분류합니다: **상승 가치** (강세 지속), **하락 가치** (약세 지속), **변동 없음 가치** (추세 지속, 낮은 변동성), **내부 가치** (변동성 높고 횡보), **외부 가치** (변동성 높고 반전 위험), 또는 **중첩** (횡보/불확실). 각각은 명확하고 잘 문서화된 시장 함의를 가집니다.


**읽는 방법:**

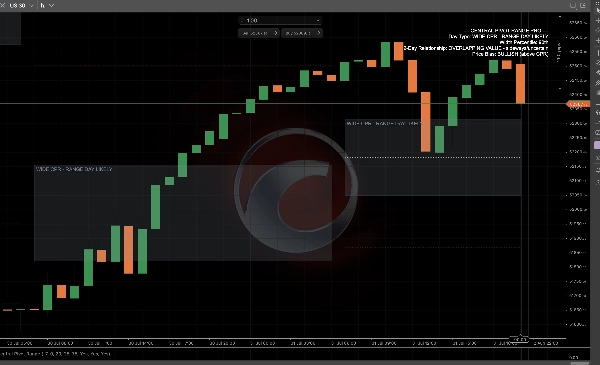
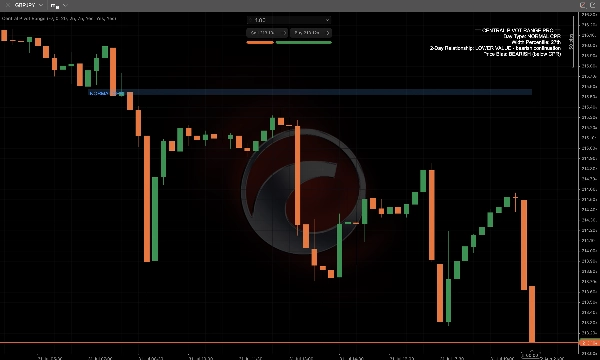
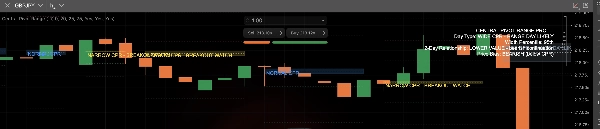
- 음영 처리된 CPR 박스는 색상 등급이 매겨져 있습니다: **금색**은 좁은 CPR(돌파 주시), **회색-파랑**은 넓은 CPR(범위일 가능성), **파랑**은 정상 폭의 날을 의미합니다.

- 표준 S1-S3/R1-R3 피벗 레벨은 보조 참조 레이어로 독립적으로 토글할 수 있습니다.

- 실시간 HUD 패널은 평이한 영어로 읽을 수 있게 해줍니다: 일 유형, 폭 백분위수, 2일 관계, 그리고 현재 가격이 강세(CPR 위), 약세(CPR 아래), 중립(CPR 내부) 중 어느 상태인지.


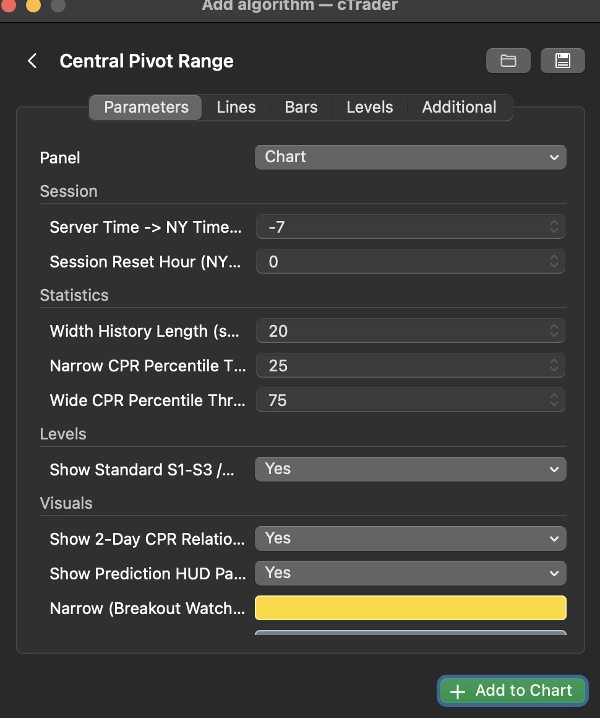
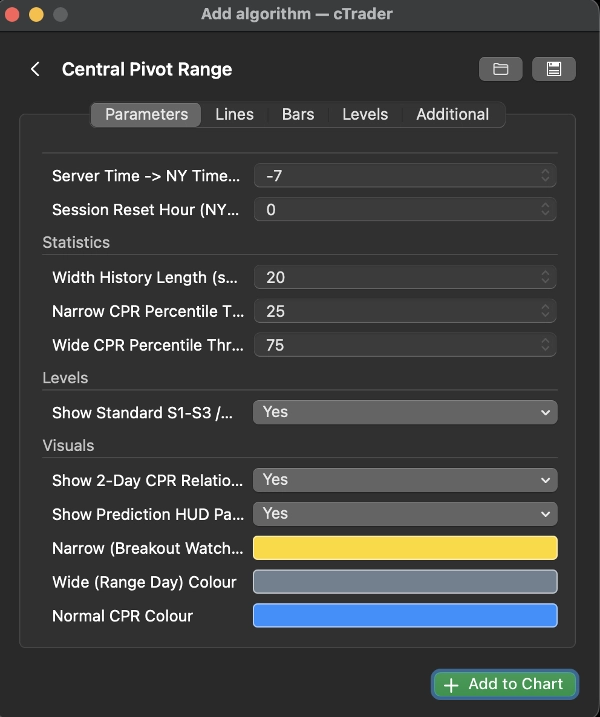
**주요 설정:** 세션 리셋 시간(정확한 일일 리셋을 위한 서버 시간과 뉴욕 시간 오프셋 포함), 폭 이력 길이 및 좁음/넓음 분류를 위한 백분위수 임계값, 그리고 표준 레벨과 관계 태그의 독립적 토글.


**일반적인 사용 사례:** 세션 시작 전에 앞으로의 세션이 추세일지 횡보일지 예측; 2일 관계를 사용해 지속과 반전일을 예상; CPR 폭을 자신의 설정과 결합해 변동성 필터로 사용; CPR 위치(강세/약세/중립)를 세션 바이어스 확인용으로 사용.


**가장 적합한 대상:** 세 개의 평평한 선 대신 객관적이고 통계적으로 근거 있는 하루 읽기를 원하는 외환 주요 통화, 지수, 금의 일중 및 데이 트레이더. 순수 장기 포지션 트레이더에게는 덜 관련성이 있습니다.


요약

AI 요약
Central Pivot Range (CPR) is an intraday trading indicator that extends traditional pivot analysis by predicting the upcoming trading day’s behavior. It calculates today’s Pivot, Top Central Pivot (TC), and Bottom Central Pivot (BC) levels from the previous session’s high, low, and close. Beyond plotting these levels, it provides two key statistical insights:

1. CPR Width Percentile: Ranks the current CPR width against recent history to indicate likely day types—narrow widths suggest potential breakout/trend days, while wide widths indicate range-bound, choppy sessions.

2. 2-Day CPR Relationship: Compares today’s CPR range to yesterday’s, classifying market conditions into categories such as bullish continuation, bearish continuation, trend continuation, choppy, volatile reversal risk, or sideways uncertainty, each with distinct implications.

The indicator visually encodes CPR width with color shading (gold for narrow, grey-blue for wide, blue for normal) and includes standard pivot levels (S1-S3, R1-R3) as optional overlays. A live HUD panel summarizes day type, width percentile, 2-day relationship, and current price position relative to CPR (bullish, bearish, neutral).

Key settings allow customization of session reset timing, width history length, percentile thresholds, and display toggles. This tool is designed for intraday and day traders focusing on forex majors, indices, and gold who seek an objective, statistically grounded forecast of daily market structure and volatility.
지표 프로필
지표 카테고리
시장 구조 (SMC)
출력 유형
시각화
신호
데이터 요구 사항
틱 데이터
지원되는 신호
추세 강도

고객 리뷰

0.0
리뷰: 0
고객 리뷰
이 상품에 대한 리뷰가 아직 없습니다. 이미 사용해 보셨나요? 다른 사람들에게 가장 먼저 소개해 주세요!

상담

자주 묻는 질문(FAQ)

Key Levels
AI-assisted
Liquidity Sweep
Market Structure
Supply & Demand
ATR
Support & Resistance
트레이딩 봇, 지표, 플러그인 등 cTrader Store에서 제공되는 상품은 제3자 개발자에 의해 제공되며, 이는 단순히 정보 및 기술적 접근을 목적으로 제공된 것입니다. cTrader Store는 중개인이 아니며, 투자 조언, 개인별 추천 또는 향후 성과에 대한 어떠한 보장도 제공하지 않습니다.

이 작성자의 상품 더 보기

멀티플랫폼 플러그인
News Filter
Risk Alerts
+5
Smart Money Concepts and ICT Trading Analytics Platform. Daily bias estimator, ICT strategty checker, TP and SL.
지표
AI-assisted
Order Block
+5
The daily bias estimator indicator uses ICT concepts to show whether the chart is bullish or bearish on multi-time frame
지표
ATR
BOS
+5
Full ICT/SMC 4-step setup checker that alerts a long or short setup.
지표
Volume
Fibonacci
+5
Classic 9:30 Opening Range Breakout — auto-plots the range, flags volume-confirmed breakouts long or short, live.
지표
Flag
VWAP
+5
Session VWAP with statistical deviation bands, gradient cloud, and live rejection alerts — see exactly how stretched pri
지표
MSS
AI-assisted
+5
Live ICT Silver Bullet detection: liquidity sweeps, structure shifts, and killzone-gated FVGs, graded and glowing in rea
지표
Triangle
Double Top
+5
Know which liquidity sweeps are real. Auto-tracks EQH/EQL and confirms genuine reversals, not just broken levels.
지표
BOS
EMA
+5
Directional volume heatmap: see if a price zone was built on buying or selling, not just how much.
지표
ATR
MSS
+5
Grades ICT Unicorn setups (Breaker Block + FVG confluence) into PRIME / SETUP / WATCH, with retest & RR targets.
지표
BOS
Volume
+5
20/40/60-day IPDA lookback ranges, Premium/Discount/Equilibrium zones, and quarterly shift alerts — anchored to true dai
지표
BOS
MSS
+5
One indicator, full ICT/SMC picture — structure, OBs, FVGs, liquidity, Premium/Discount — with graded PRIME/SETUP signal

좋아하실 만한 다른 항목

지표
Aggressive
Supertrend
+5
Stop trading with tunnel vision! 🚫 The Heat Map Dashboard is an institutional-grade visual trading assistant
지표
AI
Grid
+9
Pivot Point MultiTimeFrame with Order Block
지표
Volume
Imbalance
+5
Spot Institutional Order Flow with Proportional Volume Bubbles & Integrated Cumulative Volume Delta (CVD) Intelligence.
지표
RSI
Forex
+6
What Constance Brown did with the RSI was to input a momentum calculation within the RSI itself. This the Composite RSI.
지표
Key Levels
Liquidity Sweep
Professional Opening Range Breakout, Initial Balance, False breakout Detection
지표
Key Levels
Liquidity Grab
+2
A practical XAUUSD workspace for mapped levels, session context, liquidity events, alerts and risk planning.
지표
BOS
Fibonacci
+4
Automatically draws major trading sessions, killzones, and SMC daily liquidity targets directly on your cTrader charts.
지표
Volume
Imbalance
+1
Volume profile indicator that auto-detects the latest trendline. Shows POC, Value Area (VAH/VAL), and High Volume Nodes
지표
Smart Liquidity Zones PRO auto-detects liquidity grabs, wicks, traps & manipulations — trade like the smart money.
지표
AI
ATR
+20
Buy and Sell Signals
지표
ATR
BTCUSD
+5
Trailing algo 📈 auto-tracks trends 🎯 adapts to volatility 🌟 precise moves 🛡️ retest signals 🚀 no lag, smart market
지표
Forex
BTCUSD
+11
Unlock trading precision with QQE! Dual QQE indicators with a Bollinger Bands zero line provide clear buy/sell signals.
지표
Breakout
Allow trader to visualize Support & Resistance across different timeframes,give trader an overview of the current market
지표
Prop
Forex
+4
Pivot Points Standard — All-in-One Multi-Timeframe Pivot Indicator for cTrader
지표
Imbalance
Order Block
+5
Automated Nasdaq SMC for cTrader. Real-time FVG & Order Block mapping, interactive playbook HUD & zero-lag engine.
지표
Prop
Forex
+4
It draws Pivot Levels on the chart.
지표
MACD
Prop
+14
Customize the MACD! Choose colors, get real-time tick updates, and see crossover points for enhanced trading precision.
지표
Indices
Breakout
+1
You can use the cTrader Pivot Points Pro indicator to find a good pullback entry in a trend

가격

가입일 07/05/2026
5
판매
63
무료 설치




























