

설명
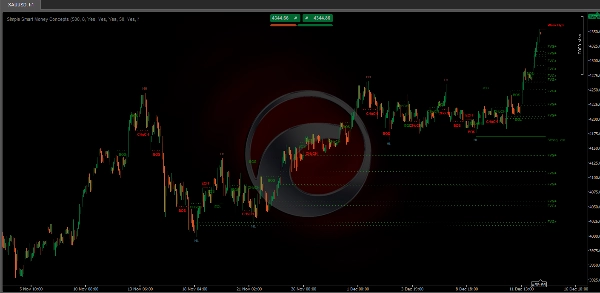
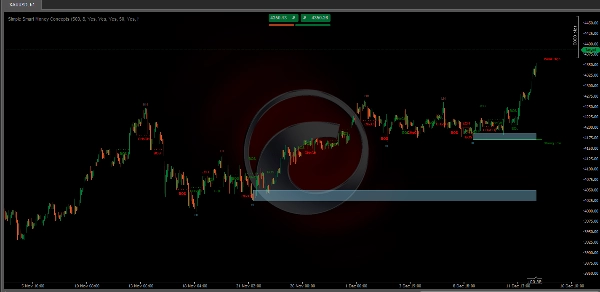
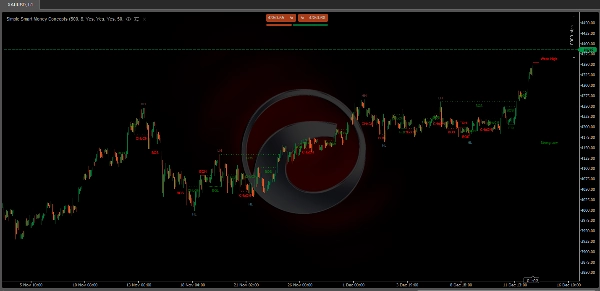
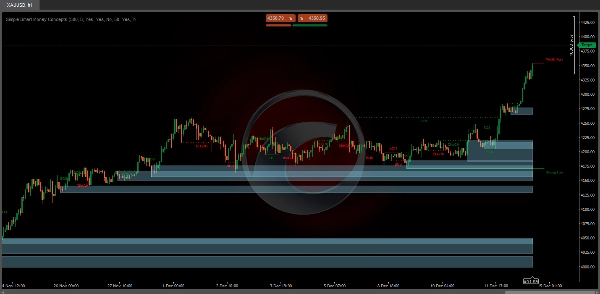
이 Simple Smart Money Concepts 지표는 실시간 시장 구조(내부 및 스윙 BOS / CHoCH), 주문 블록, 프리미엄 및 할인 구역, 동일 고점 및 저점 등 다양한 정보를 표시하여 트레이더가 널리 사용되는 가격 행동 방법론으로 차트를 자동으로 표시할 수 있게 합니다.
"Smart Money Concepts"(SMC)는 가격 행동 트레이더들 사이에서 유동성을 보다 정확하게 탐색하고 시장에서 더 최적의 관심 지점을 찾기 위해 사용되는 용어입니다. 기관 시장 참여자들이 주문을 어디에 배치했는지 파악하려는 시도는 가격 행동을 기반으로 보다 실용적인 진입 및 퇴출 지점을 찾는 매우 합리적인 접근법일 수 있습니다.
주요 특징
- 실시간 내부 및 스윙 시장 구조:
-
- 내부 구조: 이 요소들은 더 작은 범위나 특정 거래 세션 내에서 발생하는 가격 형성과 패턴을 의미합니다. 이 도구는 소규모 지지/저항 수준이나 단기 추세 반전과 같은 세부 사항을 감지할 수 있습니다.
- 외부 구조: 이는 여러 세션이나 시간 프레임에 걸친 더 크고 중요한 시장 패턴과 추세를 포함합니다. 이 기능은 트레이더가 전반적인 시장 방향을 이해하는 데 도움을 줍니다.
- HH/LH/LL/LH 영역:
-
- 고점 상승(HH), 고점 하락(LH), 저점 하락(LL), 고점 하락(LH)을 식별하여 추세와 시장 구조를 이해하고 예측 분석에 도움을 줍니다.
- 구조 붕괴(BOS):
-
- 가격이 중요한 구조를 깨는 지점을 식별하여 새로운 추세나 추세 반전을 나타낼 수 있습니다.
- 성격 변화(CHoCH):
-
- 시장 행동의 미묘한 변화를 감지하여 더 넓은 시장에 명확해지기 전에 추세 변화의 초기 단계를 암시할 수 있습니다.
- 주문 블록:
-
- 본질적으로 이전에 중요한 거래 활동이 있었던 가격 수준 또는 구역으로, 스마트 머니의 위치를 가리킬 가능성이 높습니다.
- 동일 고점 및 저점
-
- 동일 고점 및 저점을 감지하기 위해 차트에 EQH/EQL 레이블을 표시합니다.
- 공정 가치 갭:
-
- 공정 가치 갭: 중앙 캔들 옆의 캔들 그림자가 겹치지 않는 세 개의 캔들 형성으로, 갭 영역을 강조합니다.
- 이전 고점 및 저점:
-
- 사용자가 일간, 주간, 월간 시간 프레임에서 이전 고점 및 저점을 중요한 수준으로 표시할 수 있습니다.
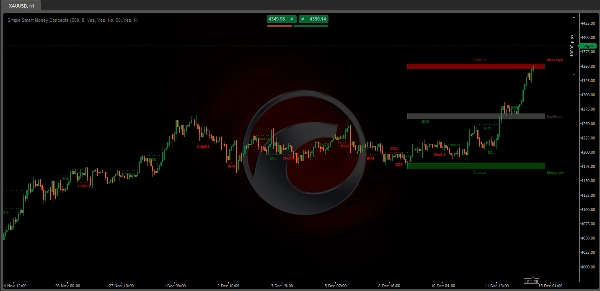
- 범위로서의 프리미엄 및 할인 구역:
-
- 사용자가 차트에 프리미엄, 할인 및 균형 구역을 표시할 수 있습니다.
사용자 정의 가능한 기능
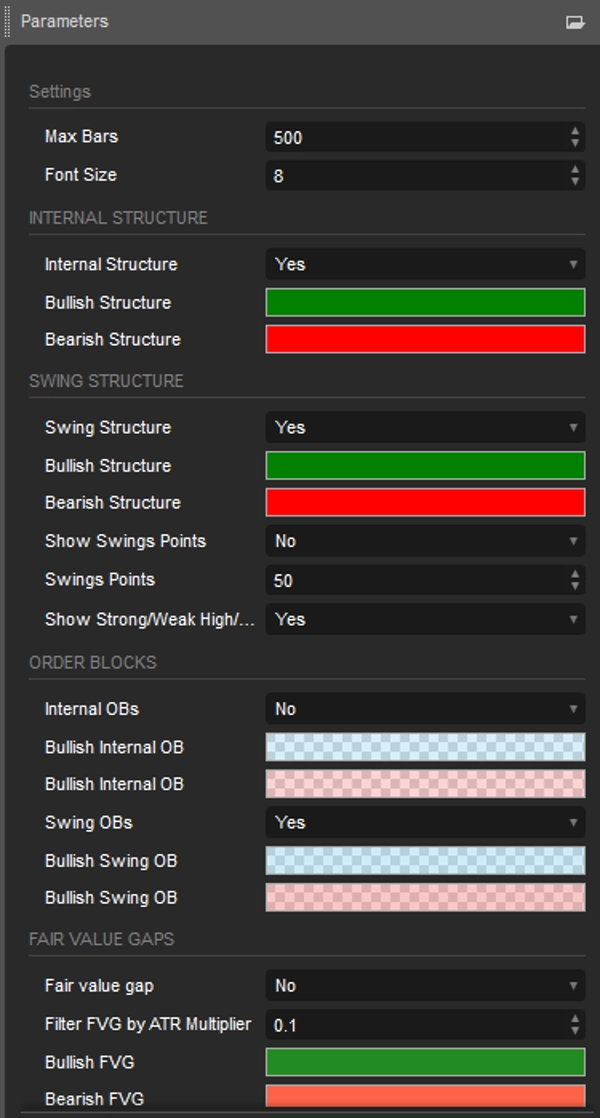
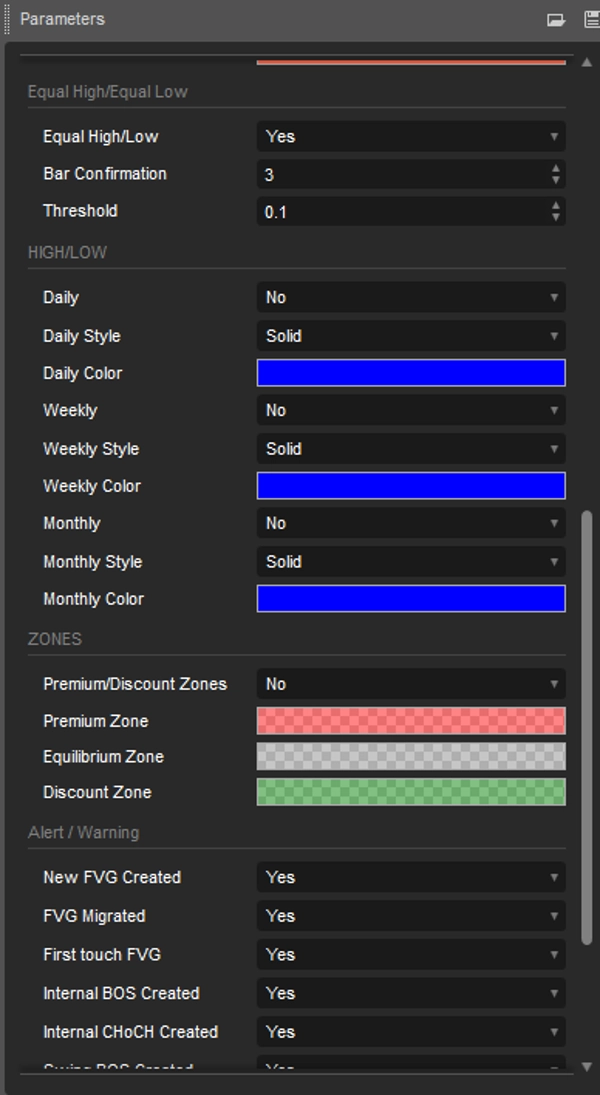
- 사용자는 데이터 길이, 색상 및 표시 스타일과 같은 설정을 조정하여 자신의 거래 선호도에 맞출 수 있습니다.
트레이더를 위한 이점
- 수동 분석에 드는 시간을 절약하여 거래 효율성을 향상시킵니다.
- 변동성이 큰 시장 상황에서 빠르고 정보에 기반한 결정을 내리는 데 도움을 줍니다.
- 초보자와 경험 많은 트레이더 모두에게 사용하기 쉽습니다.
결론
이 Simple Smart Money Concepts Indicator 는 단순한 도구가 아니라 ICT 전략을 효과적으로 구현하려는 트레이더를 위한 종합 솔루션입니다. 시장 분석을 강화하고 정확한 거래를 실행하는 데 강력한 선택입니다.
요약
AI summary
The Simple Smart Money Concepts (SMC) indicator provides real-time analysis of market structure and price action to assist traders in identifying key trading opportunities. It automatically marks charts with internal and swing market structures, including Higher Highs (HH), Lower Highs (LH), Lower Lows (LL), and Breaks of Structure (BOS). The indicator detects subtle market shifts known as Change of Character (CHoCH) and highlights order blocks—price zones where significant trading activity has occurred, often reflecting institutional interest.
Additional features include the identification of equal highs and lows, fair value gaps (three-candle formations indicating price gaps), and previous highs and lows across daily, weekly, and monthly timeframes. It also displays premium, discount, and equilibrium zones to help traders assess value areas.
Users can customize settings such as data length, colors, and display styles to fit their trading preferences. The indicator supports analysis across multiple markets including Forex, cryptocurrencies (e.g., BTCUSD), stocks, and commodities (e.g., XAUUSD).
Designed to streamline chart analysis, the Simple Smart Money Concepts indicator aids traders in making informed decisions by visually representing widely used price action methodologies and institutional order flow concepts.
Additional features include the identification of equal highs and lows, fair value gaps (three-candle formations indicating price gaps), and previous highs and lows across daily, weekly, and monthly timeframes. It also displays premium, discount, and equilibrium zones to help traders assess value areas.
Users can customize settings such as data length, colors, and display styles to fit their trading preferences. The indicator supports analysis across multiple markets including Forex, cryptocurrencies (e.g., BTCUSD), stocks, and commodities (e.g., XAUUSD).
Designed to streamline chart analysis, the Simple Smart Money Concepts indicator aids traders in making informed decisions by visually representing widely used price action methodologies and institutional order flow concepts.
지표 프로필
고객 리뷰
4.3
리뷰: 3
5 | 33 % | |
4 | 67 % | |
3 | 0 % | |
2 | 0 % | |
1 | 0 % |
고객 리뷰
December 15, 2025
Decent tool with caution for a more controlled workflow. It helps with mapping zones before entries, but zones still need manual validation. For SMC logic, I trust zones more when 0.5 mitigation, BOS and liquidity sweep line up. I would still keep manual review in the process.
December 14, 2025
December 14, 2025
Clear helper for setups around smart money style analysis. The useful part is mapping zones before entries, with the numbers checked before scaling. A good sample is 20 FVG or order block reactions, with messy 0.705 areas skipped. The zone is more convincing when structure and risk both make sense.
상담
자주 묻는 질문(FAQ)
BTCUSD
Forex
Signal
Fair Value Gap
SMC
Crypto
Stocks
XAUUSD
NAS100
트레이딩 봇, 지표, 플러그인 등 cTrader Store에서 제공되는 상품은 제3자 개발자에 의해 제공되며, 이는 단순히 정보 및 기술적 접근을 목적으로 제공된 것입니다. cTrader Store는 중개인이 아니며, 투자 조언, 개인별 추천 또는 향후 성과에 대한 어떠한 보장도 제공하지 않습니다.
이 작성자의 상품 더 보기




























가격
43
판매
2.87K
무료 설치