
Woodie_CCI
지표
73 다운로드
버전 1.0, Dec 2025
Windows, Mac
5.0
리뷰: 1
설명
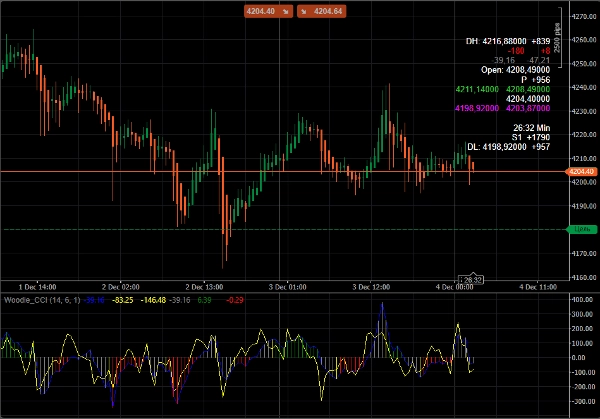
우디 CCI 지표(Woodie Commodity Channel Index)는 데이 트레이딩 및 추세 추적 거래를 위해 만들어진 고전적인 CCI 지표의 변형입니다. 이 지표는 트레이더 Ken Wood(Woodie)에 의해 대중화되었으며, 전체 Woodie's CCI 시스템 거래 시스템의 기초가 되었습니다.
요약
지표 프로필
고객 리뷰
5.0
리뷰: 1
5 | 100 % | |
4 | 0 % | |
3 | 0 % | |
2 | 0 % | |
1 | 0 % |
고객 리뷰
December 10, 2025
Woodie_CCI offers a clean, modern take on the classic CCI. Two-line structure, trend highlighting, and smooth momentum shifts make it a strong tool for intraday traders. Stable, lightweight and easy to read. Pattern detection and alerts would make it even stronger.
상담
자주 묻는 질문(FAQ)
Forex
Scalping
Indices
EURUSD
GBPUSD
Crypto
XAUUSD
트레이딩 봇, 지표, 플러그인 등 cTrader Store에서 제공되는 상품은 제3자 개발자에 의해 제공되며, 이는 단순히 정보 및 기술적 접근을 목적으로 제공된 것입니다. cTrader Store는 중개인이 아니며, 투자 조언, 개인별 추천 또는 향후 성과에 대한 어떠한 보장도 제공하지 않습니다.
이 작성자의 상품 더 보기


!["[Stellar Strategies] Inside Bar with Signals" 로고](https://cdn.ctrader.com/image/webp/1d9e8bfa-3b2c-4440-bb37-5856902008a7_30683)


가격
가입일 24/10/2025
1.43M
거래량
4.79K
핍 수익
2
판매
316
무료 설치