
Açıklama
Ana Amaç:
Fiyat seviyesine göre hacim dağılımını haritalandırarak şunları belirleyin:
Yüksek likidite alanları
Düşük likidite alanları
Alıcılar ve satıcılar arasındaki dengesizlikler
Bu gösterge, piyasa yapısını anlamak ve işlemler için yüksek olasılıklı alanları belirlemek için güçlüdür! 🎯
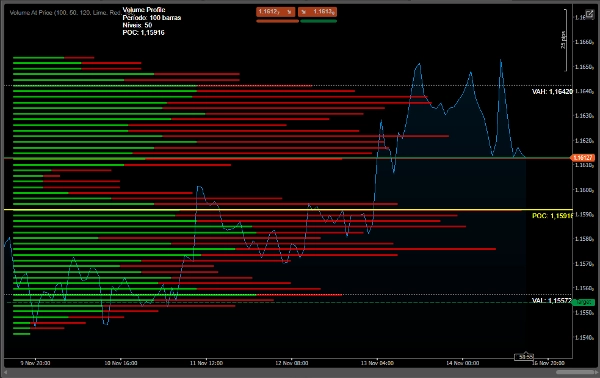
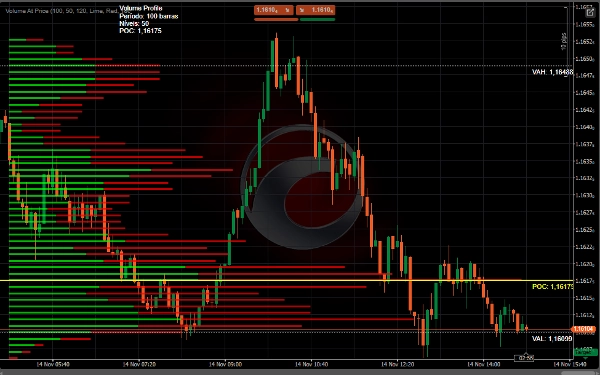
1. POC (Kontrol Noktası)
Linha Amarela - En yüksek işlem hacmine sahip fiyat
En yüksek likidite ve fiyat alanı
Doğal destek/direnç
2. Değer Alanı
Beyaz çizgiler - Hacmin %70'inin işlem gördüğü alan
VAH (Değer Alanı Yüksek) - Üst sınır
VAL (Değer Alanı Düşük) - Alt sınır
Piyasa denge bölgesi
3. Hacim Çekirdekleri
🟢 Yeşil - Baskın Alım Hacmi
🔴 Kırmızı - Baskın Satış Hacmi
Çubuk Uzunluğu = Hacim Yoğunluğu
📊 Stratejiler Kullanımı
1. Destek ve Dirençlerin Tanımlanması
• POC, destek/direnç dinamiği olarak işlev görür
• Değer Alanı denge bölgesini tanımlar
• Önemli S/D profil kenarları
2. Kopuş Analizi
• VAH üzerinde kopuş → Yüksek trend
• VAL altında kopuş → Düşüş trendi
• Kopuş olmayan hacim hareketi doğrular
3. Giriş Noktaları
• Alım: Alıcı hacmi ile VAL'in yeniden test edilmesi
• Satış: Satıcı hacmi ile VAH'nin yeniden test edilmesi
• Fade: Profilin uçlarına karşı işlem yapmak
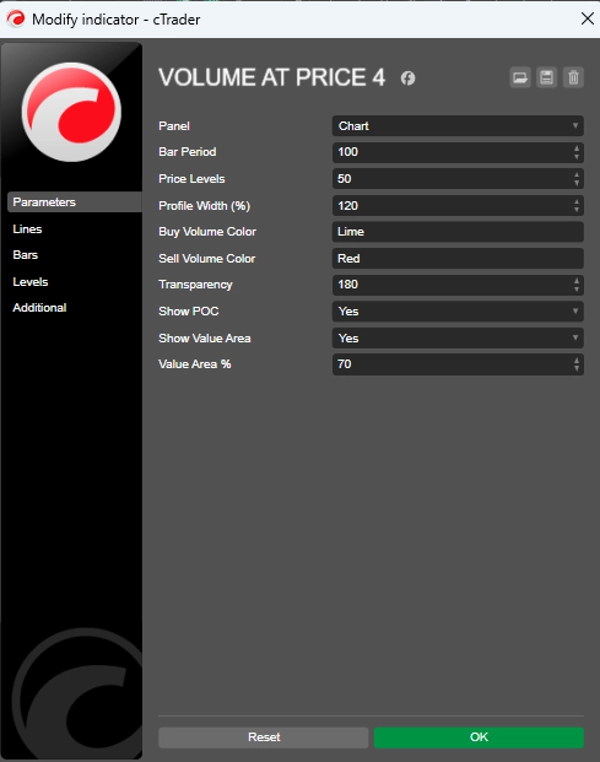
⚙️ Önerilen Ayarlar
Günlük İşlem İçin
csharp
Periyot = 50-100
Fiyat Seviyeleri = 50
Profil Genişliği = %120
Değer Alanı % = 70
Swing İşlem İçin
csharp
Periyot = 100-200
Fiyat Seviyeleri = 80
Profil Genişliği = %150
Değer Alanı % = 70
✅ AVANTAJLAR:
Dinamik destek/dirençleri tanımlar
Piyasa niyetini gösterir (hacim)
Önemli likidite alanlarını ortaya çıkarır
Dengesizliklerin net görselleştirilmesi
Mevcut hacim tiklerini sayar
Özet
- Point of Control (POC): The price level with the highest traded volume, acting as a dynamic support or resistance.
- Value Area: The price range where 70% of volume is traded, defined by Value Area High (VAH) and Value Area Low (VAL), representing market balance zones.
- Volume Cores: Colored bars indicating dominant buying (green) or selling (red) volume, with bar length reflecting volume intensity.
The indicator supports strategies like identifying support and resistance levels, breakout analysis (trend direction based on VAH and VAL breaks), and entry points (buy near VAL with buyer volume, sell near VAH with seller volume, or fade at profile extremes).
Recommended settings vary by trading style: for day trading, shorter periods and narrower profiles; for swing trading, longer periods and wider profiles. This tool aids in visualizing liquidity, market intent, and volume imbalances to inform trading decisions.
Müşteri değerlendirmeleri
5 | 0 % | |
4 | 50 % | |
3 | 50 % | |
2 | 0 % | |
1 | 0 % |


