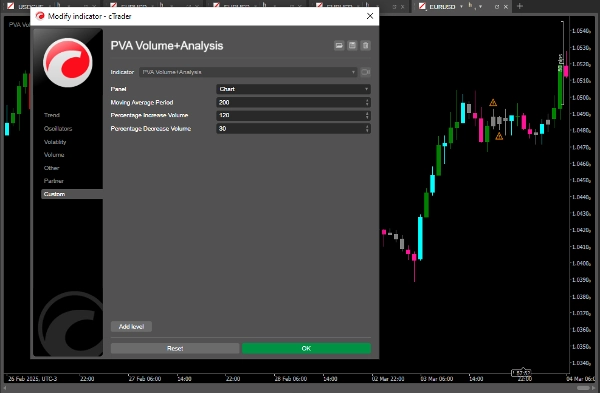
PVA (Fiyat-Hacim Analizi), bir finansal varlığın fiyatı ile işlem hacmi arasındaki ilişkiyi inceleyen teknik bir analiz yaklaşımıdır. PVA'nın temel fikri, işlem hacminin bir trendin gücü ve yönü hakkında önemli bilgiler sağlayabileceği ve bu sayede yatırımcıların daha bilinçli kararlar almasına yardımcı olabileceğidir.
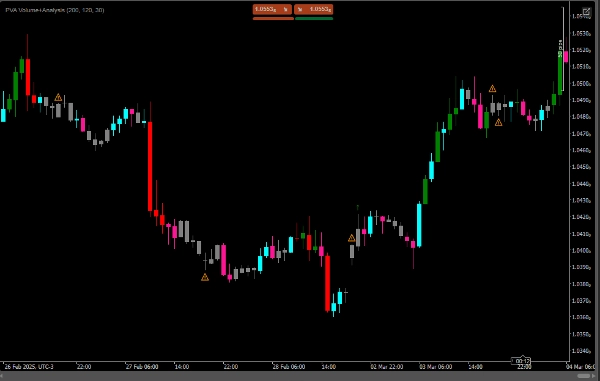
-Fiyat yükselirken artan hacim: Güçlü bir yükseliş trendini gösterir ve yeşil bir sembol (yukarı ok) görüntülenir.
-Fiyat düşerken artan hacim: Güçlü bir düşüş trendini gösterir ve kırmızı bir sembol (aşağı ok) görüntülenir.
-Fiyat yükselirken azalan hacim: Yükseliş trendinin gücünü kaybediyor olabileceğini gösterir ve turuncu bir uyarı (uyarı sembolü) görüntülenir.
-Fiyat düşerken azalan hacim: Düşüş trendinin gücünü kaybediyor olabileceğini gösterir ve yine turuncu bir uyarı (uyarı sembolü) görüntülenir.
-Hacim, yukarı veya aşağı hareket sırasında düşüyorsa, bir uyarı işareti (⚠️) çizilir.
5 | 100 % | |
4 | 0 % | |
3 | 0 % | |
2 | 0 % | |
1 | 0 % |