
الوصف
يجمع مؤشر استراتيجية MAGIC BLOCK بين نهجين رئيسيين لتحليل السوق:
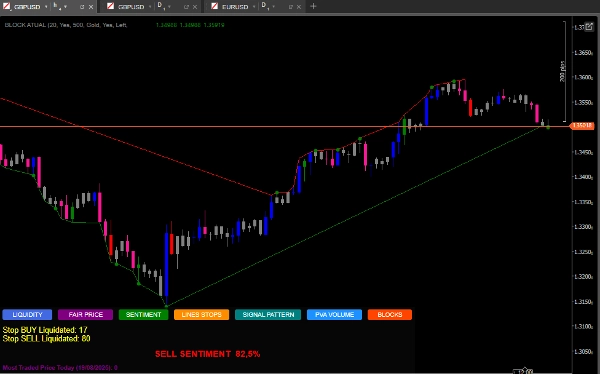
كشف كتلة الأوامر:
يحدد مناطق الدعم والمقاومة بناءً على القمم والقيعان غير المكسورة ضمن فترة المراجعة.
يولد إشارات شراء عندما يغلق السعر فوق قاع غير مكسور.
يولد إشارات بيع عندما يغلق السعر تحت قمة غير مكسورة.
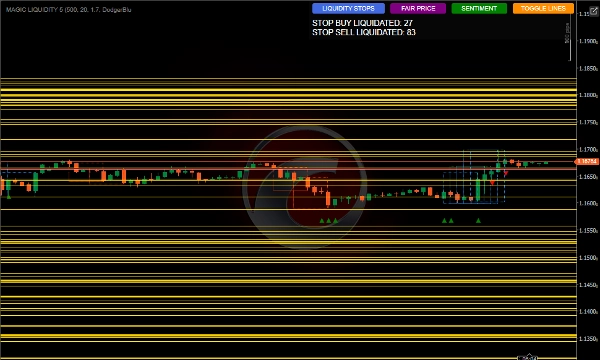
تحليل السيولة:
يكشف مناطق تجمعات السيولة حيث قد تتركز أوامر وقف الخسارة.
يراقب تفعيل أوامر الشراء والبيع.
يحسب معنويات السوق بناءً على توزيع السيولة.
يحدد السعر العادل الأكثر تداولاً.
كيفية الاستخدام لتحقيق أفضل النتائج
الإعدادات الأولية
فترة المراجعة: اضبط معلمة فترة المراجعة وفقًا للإطار الزمني الذي تتداول فيه، قيم أعلى للأطر الزمنية الأعلى.
عدد الشموع للتحليل: احتفظ به عند 500 لتحليل قوي أو قلله لتفاعلات أسرع.
لون تجمع السيولة: اختر لونًا يبرز على الرسم البياني الخاص بك.
تفسير الإشارات
إشارات كتلة الأوامر:
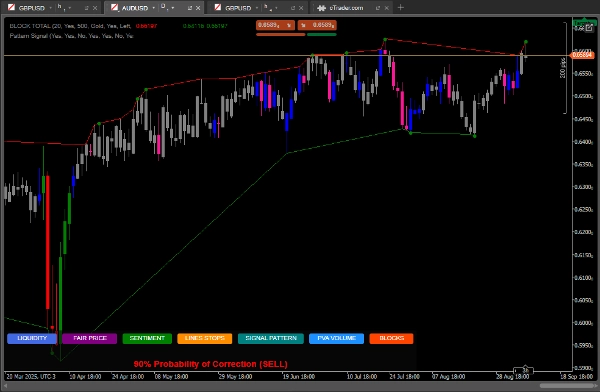
النقاط الخضراء: إشارات شراء عندما يغلق السعر فوق قاع غير مكسور.
النقاط الحمراء: إشارات بيع عندما يغلق السعر تحت قمة غير مكسورة.
تجمعات السيولة:
الخطوط الأفقية تظهر مناطق السيولة، أهداف محتملة أو نقاط انعكاس.
راقب العلاقة بين السيولة فوق/تحت السعر الحالي.
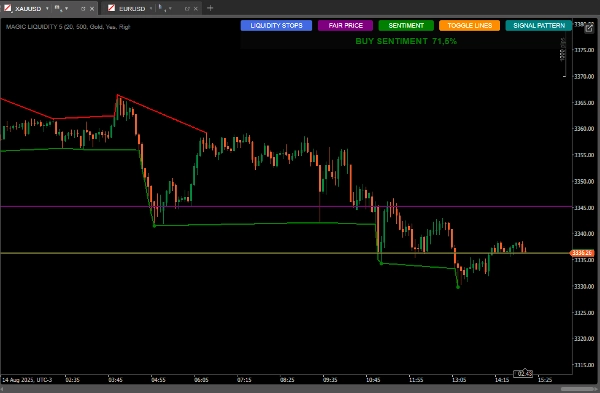
معنويات السوق:
استخدم زر SENTIMENT لرؤية الاتجاه السائد والثقة.
تشير معنويات الشراء ذات الثقة العالية إلى استمرار النمو. وتشير معنويات البيع ذات الثقة العالية إلى استمرار هبوطي.
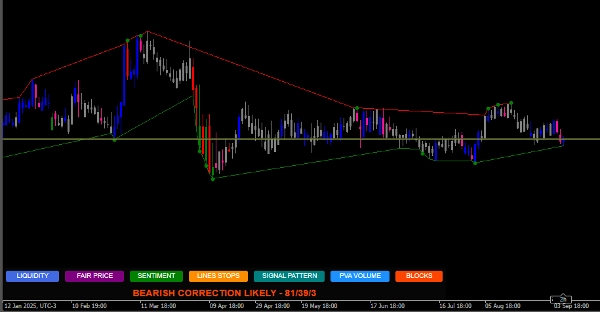
أنماط الشموع:
زر SIGNAL PATTERN يحلل و
يعرض احتمالات التصحيح بناءً على النسبة الكمية
السعر العادل الأكثر تداولاً:
زر PRICE يعرض مستوى السعر بأعلى حجم تداول في اليوم.
يمكن أن يعمل كمغناطيس للأسعار أو كدعم/مقاومة.
استراتيجيات الاستخدام
الاستراتيجية المحافظة:
تداول فقط عندما تتطابق إشارات كتلة الأوامر مع المعنويات السائدة.
استخدم تجمعات السيولة كأهداف لجني الأرباح.
الاستراتيجية العدوانية:
توقع الانعكاسات عندما يقترب السعر من تجمعات السيولة التي تحتوي على العديد من أوامر الوقف المتراكمة.
استخدم التباينات بين المعنويات وحركة السعر للصفقات المضادة للاتجاه.
تأكيد إضافي:
قارن مع نمط الشمعة المعروض بواسطة المؤشر.
تحقق مما إذا كان السعر العادل قريبًا كمنطقة اهتمام.
إدارة المخاطر.
وقف الخسارة:
ضعه تحت أحدث كتلة أوامر للشراء
ضعه فوق أحدث كتلة أوامر للبيع
جني الأرباح:
الأهداف في تجمعات السيولة القريبة
اعتبر نسبة السيولة فوق/تحت لتحديد الأهداف
نصائح متقدمة
استخدم زر TOGGLE LINES لتعطيل خطوط السيولة عندما يصبح الرسم البياني مزدحمًا
راقب عدد أوامر الوقف التي تم تصفيتها لتقييم قوة الحركة
السعر العادل مفيد بشكل خاص في الأسواق المحصورة مثل الدعم/المقاومة الديناميكية
ادمج مع مؤشرات أخرى للتأكيد مثل الحجم، المتوسطات المتحركة
نمط الإشارة متاح في الإطار الزمني D1.
https://ctrader.com/pt/products/1725?u=Goulart
https://ctrader.com/pt/products/1386?u=Goulart
الملخص
The indicator also analyzes liquidity pools, highlighting areas where stop losses may accumulate and monitoring the activation of buy and sell stops. It calculates market sentiment based on liquidity distribution and identifies the most traded price level of the day, which can act as dynamic support or resistance.
Users can customize parameters such as lookback period and number of candles for analysis to suit different timeframes and trading styles. Visual signals include green and red dots for buy and sell order block signals, horizontal lines for liquidity pools, and sentiment indicators showing prevailing market direction and confidence.
The tool supports conservative strategies that align order block signals with sentiment and use liquidity pools as profit targets, as well as aggressive strategies that anticipate reversals near liquidity pools and exploit divergences between sentiment and price action. Additional features include candlestick pattern correction probabilities and options to toggle liquidity lines for chart clarity. Risk management guidance suggests placing stop-loss orders relative to recent order blocks and setting take-profit targets near liquidity pools.


![شعار "[Stellar Strategies] BOS Trend 1.0"](https://cdn.ctrader.com/image/webp/6cdec0f1-0e97-4a82-a8a4-2b67aed54d38_25695)


