
الوصف
الإصدار الموسع متاح — هنا
أنت تشاهد النسخة الأصلية حالياً. تم إصدار النسخة الموسعة من هذا المؤشر مع ميزات إضافية:
- عرض العمر المحسن: صيغة السنوات، الأشهر، الأسابيع، الأيام (مثلاً، "3y 2w 4d")
- عرض جميع فجوات القيمة العادلة: اضبط "FVG to Display" على -1 لعرض عدد غير محدود من فجوات القيمة العادلة التاريخية
- تمديد فجوات القيمة العادلة المملوءة: خيار لتمديد صناديق فجوات القيمة العادلة المملوءة إلى الشمعة الحالية
- مستويات فيبوناتشي: مستويات تلقائية (23.6%, 38.2%, 50%, 61.8%, 78.6%) على الفجوات الجزئية والمملوءة
- عتبة التعبئة الجزئية: عتبة قابلة للتخصيص (50-99%, الافتراضي 90%)
__________________________________________________________________________________________
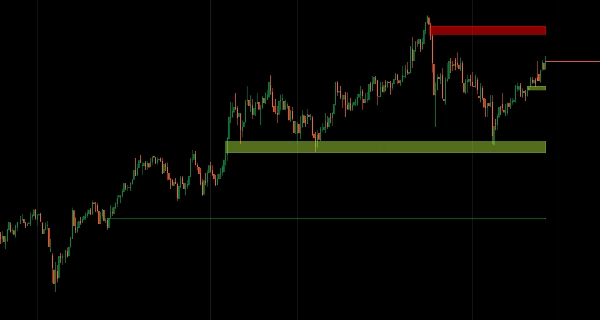
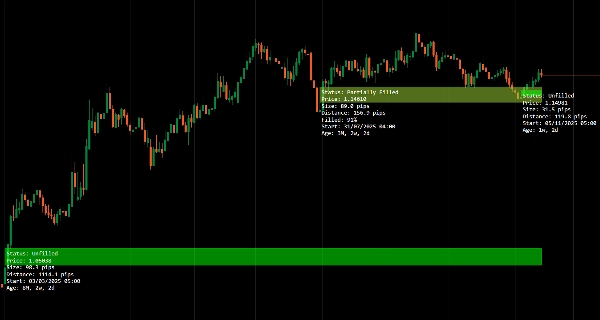
تحديد فجوات القيمة العادلة مع تتبع العمر ومراقبة حالة التعبئة.
يكتشف تلقائياً الفجوات الصعودية والهبوطية، ويتتبع سلوك تعبئتها (غير مملوءة، جزئياً، مملوءة بالكامل) في الوقت الحقيقي، ويعرض عمر الفجوة لتحديد الأولويات.
مسح متعدد الأطر الزمنية لمزامنة فجوات الهيكل الزمني الأعلى مع حركة السعر في الإطار الزمني الأدنى، تحديثات الحالة الديناميكية مع تفاعل السعر مع المناطق، وتسميات غير متطفلة لتقديم تحليل تركيز عدم توازن السيولة للمتداولين الذين يستهدفون تعبئة الفجوات والدخول المبني على الهيكل.
الميزات
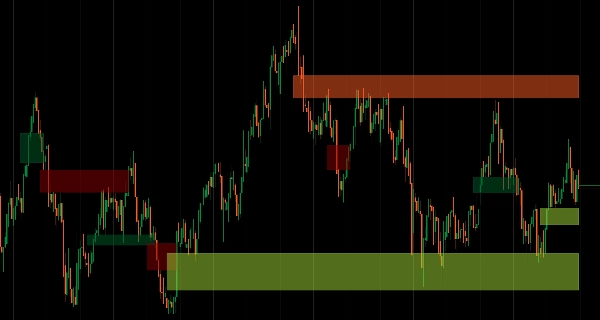
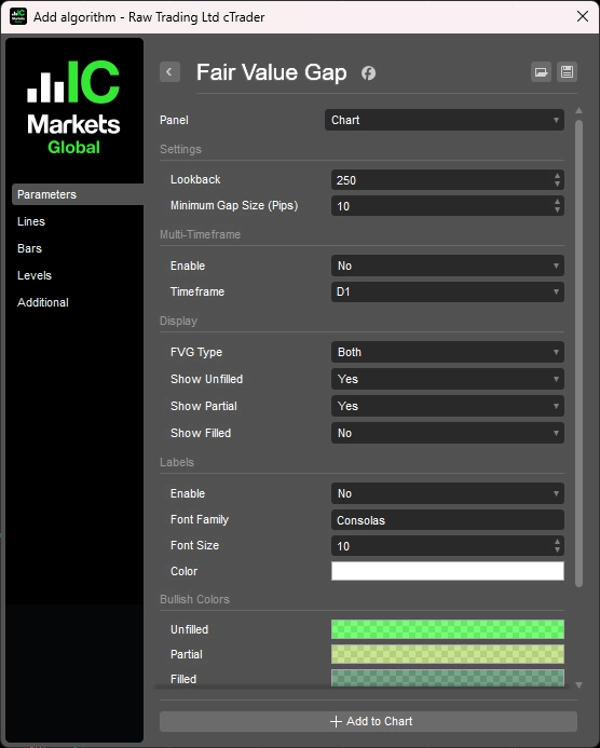
تحديد فجوات القيمة العادلة
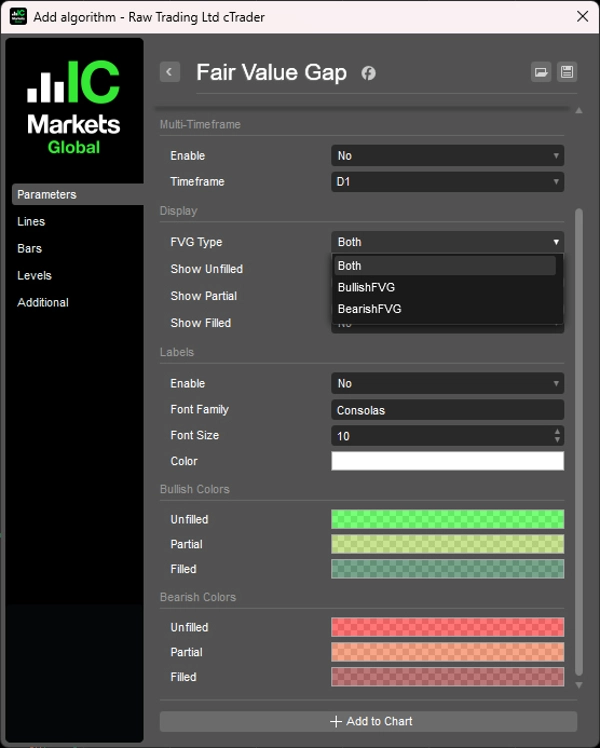
- يكتشف تلقائياً فجوات القيمة العادلة الصعودية والهبوطية
- يتتبع حالة التعبئة: غير مملوءة، مملوءة جزئياً، ومملوءة بالكامل في الوقت الحقيقي
- رسم بصري نظيف مع أقل قدر من الفوضى على الرسم البياني
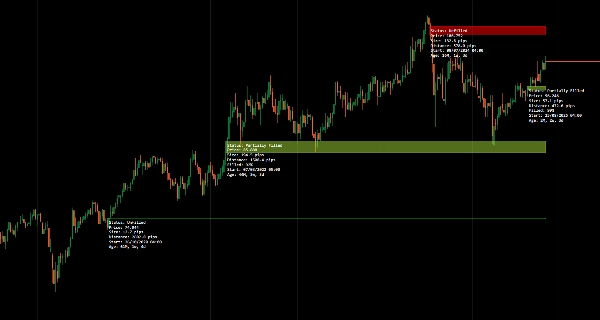
تسمية العمر
- يعرض مقدار الوقت الذي مضى منذ تكوّن كل فجوة
- يساعد في تحديد الأولويات بين الفجوات الجديدة والقديمة لاختيار الصفقات
- سياق الوقت يحسن اتخاذ القرار بشأن أهمية الفجوة
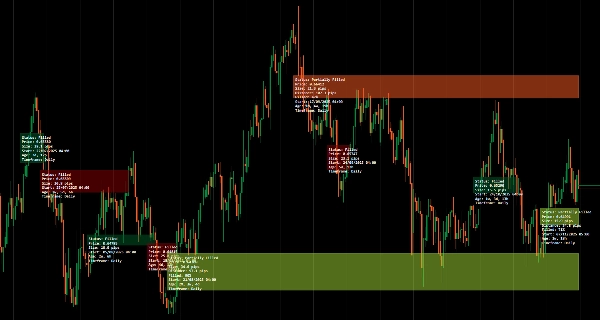
تتبع الحالة
- يعرض حالة التعبئة الحالية: غير مملوءة، مملوءة جزئياً، أو مملوءة بالكامل
- يتحدث ديناميكياً مع تفاعل السعر مع الفجوة
- تأكيد بصري على التقاط السيولة
وضع متعدد الأطر الزمنية
- مسح وعرض فجوات القيمة العادلة للإطار الزمني الأعلى على الرسوم البيانية للإطار الزمني الأدنى
- مزامنة فجوات الهيكل الزمني الأعلى مع حركة السعر في الإطار الزمني الأدنى
- يحسن سير عمل التحليل متعدد الأطر الزمنية
واجهة مستخدم نظيفة وبسيطة
- تسميات غير متطفلة مصممة للوضوح
- معلوماتية دون ازدحام عرض السعر
- عرض احترافي لتحليل مركز
__________________________________________________________________________________________
مؤشرات مجانية أخرى
استكشف مجموعة واسعة من أدوات تحليل السوق — من الهيكل والحجم إلى الانحدار، التقلب، والأطر الزمنية المخصصة.
رمز المصدر متاح على مستودع GitHub.
جميعها مجانية للاستخدام. ولكن إذا رغبت في دعم القهوة، يمكنك التبرع هنا.
الدعم/المقاومة
الحجم
- محلل نشاط الحجم
- محلل كفاءة الحجم
- تحليلات ملف الحجم
- ملف الحجم - محدث
- تحليل انتشار الحجم
- VWAP (متوسط السعر المرجح بالحجم)
المتوسطات المتحركة
- المتوسط المتحرك المثبت
- المتوسط المتحرك بمقياس الانحراف
- خط الاتجاه اللحظي
- متوسط كوفمان التكيفي مع رؤية الاتجاه
- قناة المتوسط المتحرك
- مجموعة المتوسطات المتحركة
- متوسط قناة الاتجاه المتحرك
الأدوات المساعدة/المخصصة
مبني على الانحدار
التقلب
المؤشرات المتذبذبة
__________________________________________________________________________________________
إخلاء المسؤولية
التداول ينطوي على مخاطر. هذا المؤشر مخصص للتحليل الفني فقط — دائماً طبق إدارة المخاطر المناسبة وتداول بمسؤولية.
التعليقات والتحسينات
إذا كان لديك اقتراحات، طلبات ميزات، أو أفكار للتحسين، يرجى ترك تعليق في تبويب النقاش. تساعد ملاحظاتك في تحسين المؤشر للجميع.
الملخص
تقييمات العملاء
5 | 100 % | |
4 | 0 % | |
3 | 0 % | |
2 | 0 % | |
1 | 0 % |


