الوصف
ملاحظات هامة - اقرأ أولاً
حجم الفوركس ليس الحجم الحقيقي
الحجم في الفوركس هو حجم التيك — يحسب عدد مرات تغير السعر. لا يحسب مقدار المال الذي تم تداوله.
ما لا يمكن أن يظهره حجم التيك
- حجم الصفقة. صفقة بقيمة 100 دولار وصفقة بقيمة 10,000,000 دولار كلاهما يحتسب كتيك واحد.
- تدفق المال الحقيقي. لا يمكنك رؤية ما إذا كان المال الكبير أو الصغير هو الذي حرك السعر.
- السيولة الحقيقية. لا يمكنك رؤية عدد الأوامر المنتظرة في السوق.
- نشاط البنوك. البنوك ترى بيانات الحجم الحقيقي. أنت لا ترى ذلك.
ما يعنيه هذا
حجم التيك يظهر فقط عدد مرات تغير السعر — وليس المال وراءه. هذا يخلق مشاكل:
- لا يمكنك تتبع البنوك أو المؤسسات. فهي تستخدم بيانات الحجم الحقيقي التي لا يمكنك الوصول إليها.
- لا يمكنك إثبات نظريات "المال الذكي". هذه الأفكار تحتاج إلى حجم حقيقي، وليس عد التيكات.
- لا يمكنك الحكم على السيولة الحقيقية. نشاط التيك لا يظهر عمق الأوامر أو قوة السوق الحقيقية.
- لا يمكنك قياس قوة الشراء أو البيع الحقيقية. العديد من الصفقات الصغيرة تبدو مثل صفقة مؤسسية كبيرة واحدة.
- ارتفاعات الحجم قد تكون مضللة. قد يكون الارتفاع مجرد ضوضاء خوارزمية، وليس اهتمام تداول حقيقي.
كيفية استخدام هذا المؤشر بشكل صحيح
- اعتبره مقياس نشاط، وليس مقياس مال. حجم التيك العالي = السوق نشط. حجم التيك المنخفض = السوق هادئ. لا أكثر.
- قارن النشاط بين أوقات مختلفة. استخدمه لمعرفة: هل جلسة لندن أكثر نشاطًا من نيويورك؟ هل اليوم أكثر نشاطًا من الأمس؟ هل فترة الاتجاه أكثر نشاطًا من فترة التوحيد؟
- ادمجه مع هيكل السعر. استخدم الدعم/المقاومة، نقاط التأرجح، أو BOS/ChoCH مع الحجم. سياق السعر يمنع الإشارات الخاطئة من ارتفاعات الحجم المزعجة.
- راقب النشاط عند مستويات السعر المهمة. عندما يختبر السعر مستوى رئيسي ويزداد حجم التيك، فهذا يعني أن المزيد من المتداولين نشطون. لا يعني ذلك أن اللاعبين الكبار متورطون.
- لا تفترض أنه يظهر نشاط المؤسسات. حجم التيك لا يمكن أن يظهر التراكم، الأوامر الكبيرة، أو "المال الذكي". استخدمه فقط لقياس الإيقاع والسرعة.
__________________________________________________________________________________________
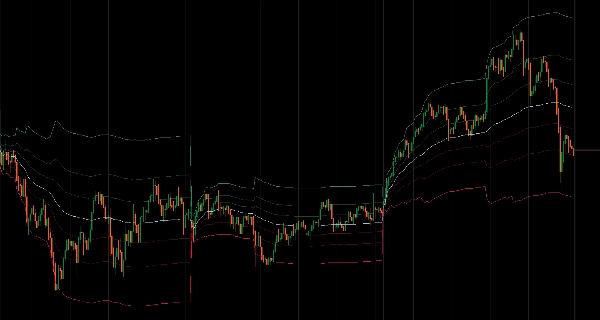
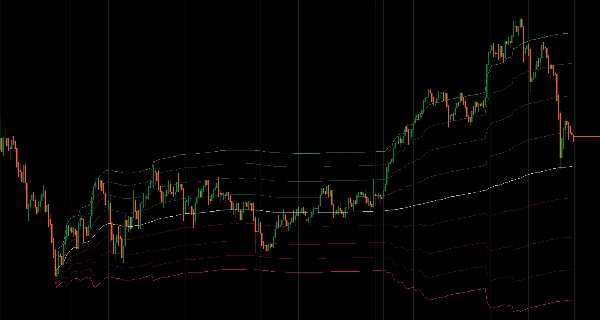
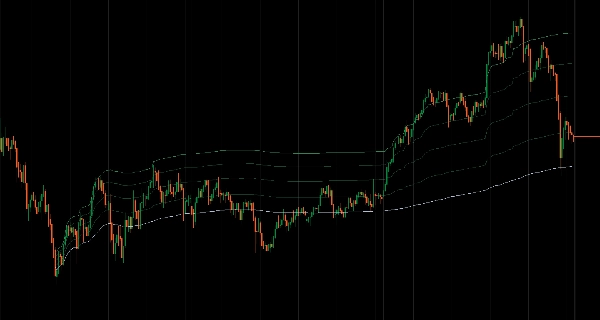
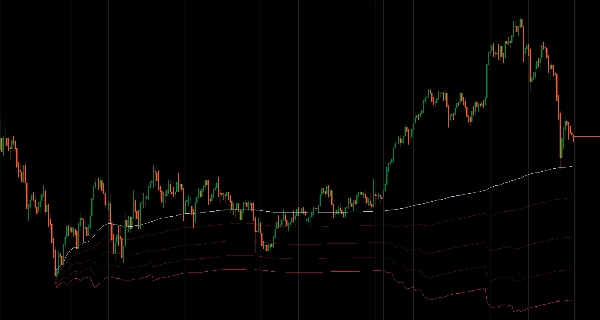
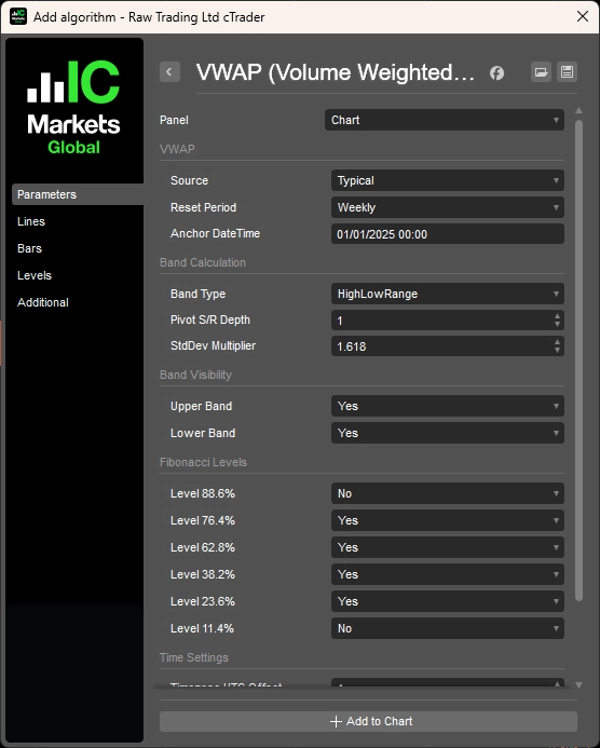
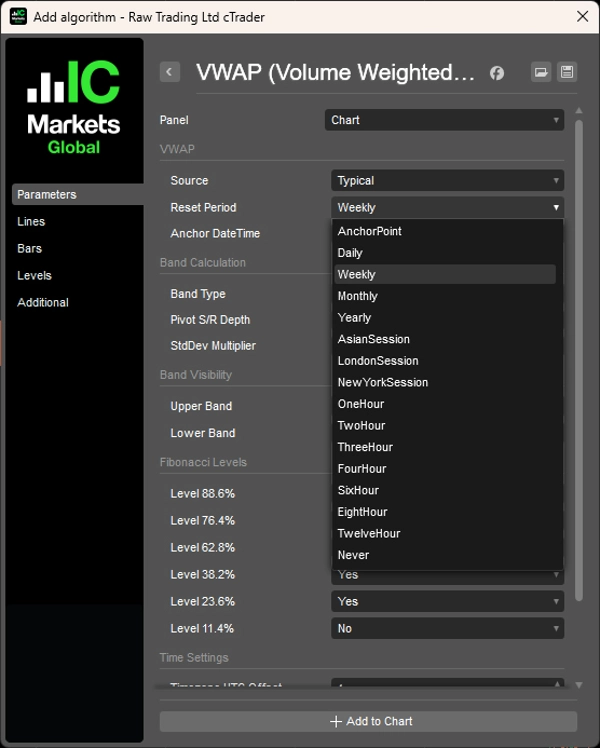
متوسط السعر المرجح بالحجم مع فترات إعادة تعيين مرنة وثلاث طرق لحساب النطاقات.
يحسب متوسط السعر المرجح بالحجم مع فترات إعادة تعيين مرنة تشمل فترات زمنية (يومي، أسبوعي، شهري، سنوي، أو ساعي مخصص)، إعادة تعيين بناءً على الجلسات (الآسيوية، لندن، نيويورك مع أوقات بدء قابلة للتكوين)، وضع نقطة التثبيت لتثبيت VWAP على أحداث محددة، أو حساب متداول من جميع البيانات المتاحة.
يقدم ثلاث طرق لحساب النطاقات: نطاق عالي/منخفض بناءً على نطاق السعر للفترة السابقة، نقطة ارتكاز فيبوناتشي باستخدام حسابات الارتكاز الكلاسيكية، ونطاقات الانحراف المعياري التي تتوسع وتتقلص مع التقلب.
يمكنك تخصيص ثمانية مستويات فيبوناتشي (100%، 88.6%، 76.4%، 62.8%، 50%، 38.2%، 23.6%، 11.4%، 0%) مع مفاتيح رؤية فردية وتحكم سريع لمجموعات النطاقات العليا/السفلى. إدارة الجلسات تشمل تكوين وقت بدء دقيق مع تعديل تعويض UTC ومعالجة إعادة التعيين الساعية مع الوعي بالمنطقة الزمنية.
الميزات
- فترات إعادة تعيين مرنة
-
- زمنية: يومية، أسبوعية، شهرية، سنوية، أو فترات ساعية مخصصة (1س، 2س، 3س، 4س، 6س، 8س، 12س)
- بناءً على الجلسة: جلسات آسيوية، لندن، نيويورك مع أوقات بدء قابلة للتكوين وتعويضات المنطقة الزمنية
- نقطة التثبيت: تثبيت VWAP على أي تاريخ ووقت محدد للتحليل المعتمد على الأحداث
- متداول: حساب من جميع البيانات المتاحة بدون إعادة تعيين
- ثلاث طرق لحساب النطاقات
-
- نطاق عالي/منخفض: نطاقات بناءً على نطاق سعر الفترة السابقة
- نقطة ارتكاز فيبوناتشي: حساب نقطة الارتكاز الكلاسيكية من H/L/C للفترة السابقة
- الانحراف المعياري: نطاقات إحصائية تقليدية تتوسع وتتقلص مع التقلب
- تحكم كامل في مستويات فيبوناتشي
-
- 8 مستويات قابلة للتخصيص: 100%، 88.6%، 76.4%، 62.8%، 50% (VWAP)، 38.2%، 23.6%، 11.4%، 0%
- مفاتيح رؤية فردية لكل مستوى
- تحكم مجموعات النطاقات العليا/السفلى للتعديل السريع
- إدارة الجلسات
-
- تكوين أوقات بدء الجلسة بدقة مع تعديل تعويض UTC (-12 إلى +14 ساعة)
- عرض معلومات الجلسة المرئية يظهر جدول إعادة التعيين الحالي
- معالجة إعادة التعيين الساعية مع الوعي بالمنطقة الزمنية
- محسن للأداء
-
- حساب كسول — النطاقات تحسب فقط عند ظهورها
- تخزين ذكي ومعالجة دفعات
- تأثير منخفض على وحدة المعالجة حتى مع تفعيل جميع المستويات
__________________________________________________________________________________________
مؤشرات مجانية إضافية
استكشف مجموعة واسعة من أدوات تحليل السوق — من الهيكل والحجم إلى الانحدار، التقلب، والفترات الزمنية المخصصة.
الكود المصدري متاح على مستودع GitHub.
جميعها مجانية للاستخدام. ولكن إذا رغبت في دعم القهوة، يمكنك التبرع من هنا.
الدعم/المقاومة
الحجم
- محلل نشاط الحجم
- محلل كفاءة الحجم
- تحليلات ملف الحجم
- ملف الحجم - محدث
- تحليل انتشار الحجم
- VWAP (متوسط السعر المرجح بالحجم)
المتوسطات المتحركة
- قناة SSL
- المتوسط المتحرك المثبت
- المتوسط المتحرك بمقياس الانحراف
- منشط Gann عالي ومنخفض
- خط الاتجاه اللحظي
- متوسط Kaufman التكيفي مع رؤية الاتجاه
- قناة المتوسط المتحرك
- مجموعة المتوسطات المتحركة
- متوسط قناة الاتجاه المتحرك
الأدوات المساعدة/مخصصة
المبنية على الانحدار
التقلب
المذبذبات
__________________________________________________________________________________________
إخلاء المسؤولية
التداول ينطوي على مخاطر. هذا المؤشر مخصص للتحليل الفني فقط — دائماً طبق إدارة مخاطر مناسبة وتداول بمسؤولية.
التعليقات والتحسينات
إذا كانت لديك اقتراحات، طلبات ميزات، أو أفكار للتحسين، يرجى ترك تعليق في تبويب النقاش. ملاحظاتك تساعد في تحسين المؤشر للجميع.
الملخص
The indicator offers three band calculation methods: High/Low Range bands based on the previous period's price range, Fibonacci Pivot bands using classical pivot calculations, and Standard Deviation bands that adjust with market volatility. Users can customize eight Fibonacci levels (ranging from 0% to 100%) with individual visibility toggles and group controls for upper and lower bands.
Session management features include precise start time configuration with UTC offset adjustments and timezone-aware hourly resets, along with visual session information display. Performance optimizations include lazy calculation of bands only when visible, intelligent caching, and batch processing to minimize CPU usage.
Note: For forex markets, volume data represents tick volume (price change counts) rather than actual traded volume, so this indicator should be used as a measure of market activity rather than real money flow. It is intended for technical analysis with proper risk management.
تقييمات العملاء
5 | 100 % | |
4 | 0 % | |
3 | 0 % | |
2 | 0 % | |
1 | 0 % |