الوصف
هيكل نطاق الافتتاح عبر أي فترة—جلسات داخل اليوم إلى دورات سنوية—مع مستويات فيبوناتشي وتوقعات الامتداد.
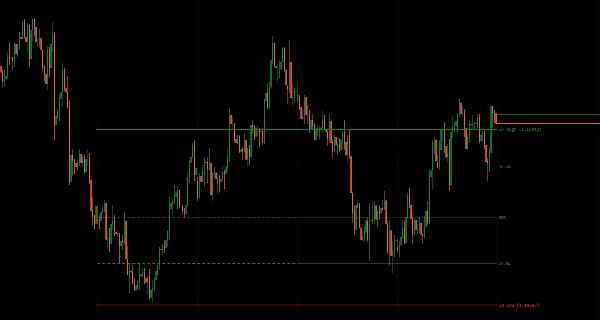
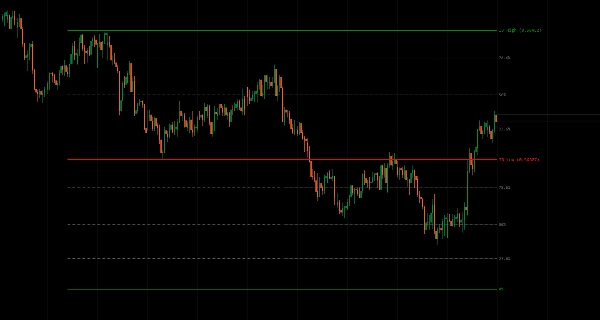
يحدد نطاق الأعلى/الأدنى الذي تم تأسيسه خلال فترات الافتتاح (يومي، أسبوعي، شهري، ربع سنوي، سنوي، أو نطاق مخصص) كمرجع للاختراقات، والارتداد إلى المتوسط، وتوقعات التقلب.
ثمانية أنواع فترات مع اكتشاف الجلسة مع مراعاة المنطقة الزمنية (سيدني/طوكيو/لندن/نيويورك)، تعويض تاريخي للمقارنة متعددة الفترات، سبعة مستويات فيبوناتشي اختيارية (11.4% إلى 88.6%) داخل نطاق IB، توقعات صعودية/هبوطية من الحدود، تحكم مرن في امتداد الخط (فترة IB فقط، الشمعة الحالية، أو N فترات للأمام)، واكتشاف دقيق للفترة يقدم تحليلاً شاملاً لنطاق الافتتاح للمتداولين الذين يستهدفون إعدادات قائمة على الهيكل عبر جميع الأطر الزمنية.
الميزات
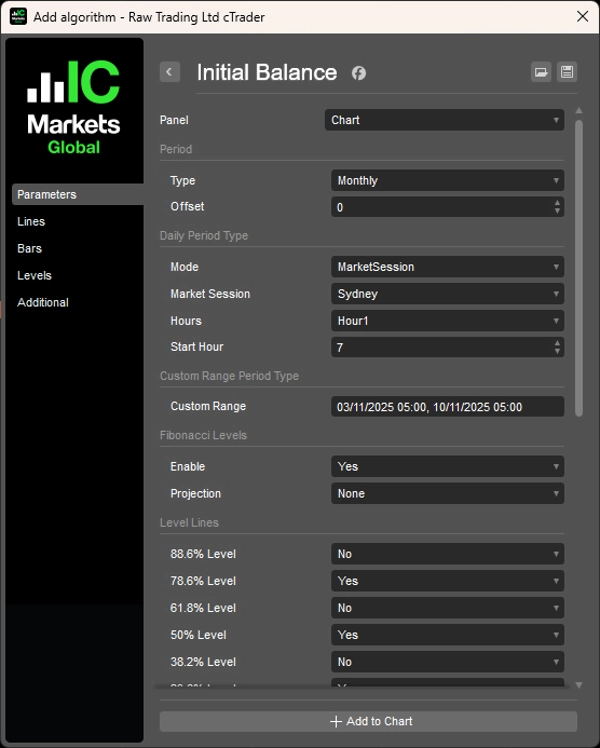
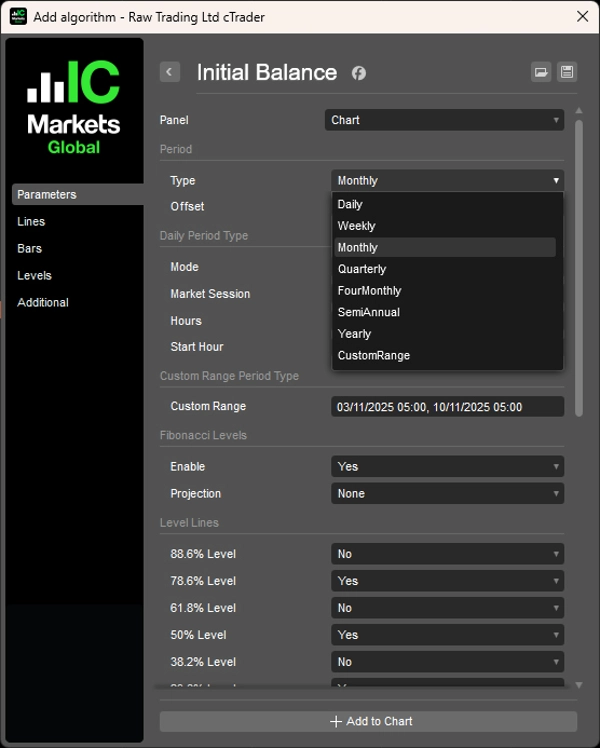
8 أنواع فترات
- يومي، أسبوعي، شهري، ربع سنوي، 4 أشهر، نصف سنوي، سنوي، نطاق مخصص
- أنماط يومية: تعتمد على الساعات (1-12 ساعة) أو جلسة السوق (سيدني/طوكيو/لندن/نيويورك)
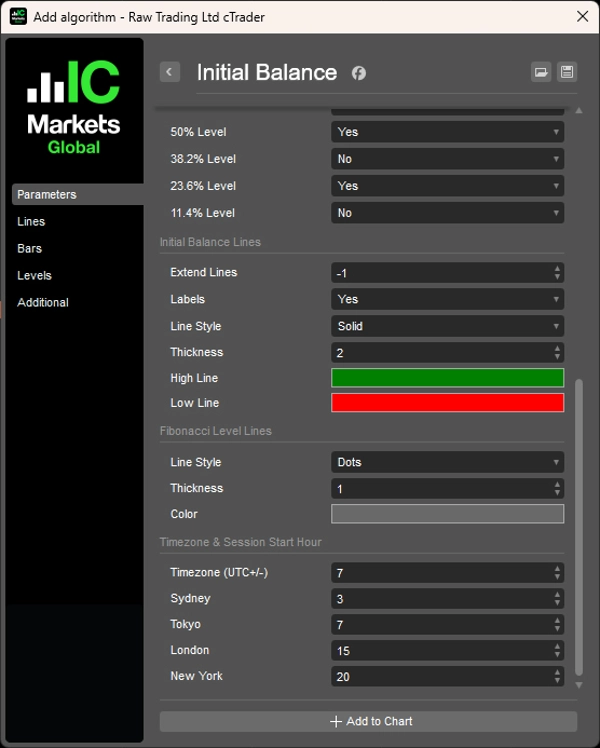
- أوقات بدء الجلسة القابلة للتكوين مع تعديل تعويض UTC مع مراعاة المنطقة الزمنية
- نطاق مخصص: تحديد وقت بدء/انتهاء دقيق لتحليل قائم على الحدث
الفترات التاريخية
- معامل التعويض لعرض نطاقات IB السابقة (مثلاً، IB الأسبوع الماضي، IB الشهر الماضي)
- مقارنة حركة السعر الحالية مع هياكل الفترات السابقة
- تحليل متعدد الفترات لتأكيد الاتجاه
مستويات فيبوناتشي
- 7 مستويات اختيارية (11.4%، 23.6%، 38.2%، 50%، 61.8%، 78.6%، 88.6%) داخل نطاق IB
- مناطق الارتداد إلى المتوسط داخل التوازن
- نقاط مرجعية دقيقة للدخول/الخروج
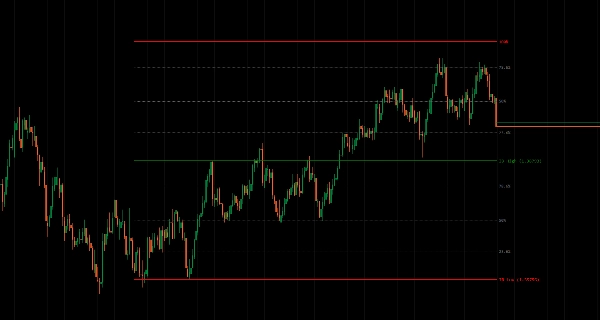
توقعات فيبوناتشي
- توقع المستويات صعوداً/هبوطاً من أعلى/أدنى IB
- أهداف اختراق محتملة تتجاوز النطاق
- مناطق امتداد للحركات الاتجاهية
التحكم في امتداد الخط
- فترة IB فقط: عرض النطاق خلال فترة التكوين
- الشريط الحالي: التمديد إلى الحاضر
- N فترات للأمام: التوقع للمستقبل للتخطيط
- إدارة بصرية نظيفة
اكتشاف دقيق للفترة
- حساب دقيق لنطاق الافتتاح لكل نوع فترة
- مع مراعاة المنطقة الزمنية للأسواق العالمية
- يتعامل مع تداخلات الجلسات والانتقالات بشكل نظيف
__________________________________________________________________________________________
مزيد من المؤشرات المجانية
استكشف مجموعة واسعة من أدوات تحليل السوق—من الهيكل والحجم إلى الانحدار، والتقلب، والأطر الزمنية المخصصة.
رمز المصدر متاح على مستودع GitHub.
جميعها مجانية للاستخدام. ولكن إذا رغبت في دعم القهوة، يمكنك توجيه الدعم من هنا.
الدعم/المقاومة
الحجم
- محلل نشاط الحجم
- محلل كفاءة الحجم
- تحليلات ملف الحجم
- ملف الحجم - محدث
- تحليل انتشار الحجم
- VWAP (متوسط السعر المرجح بالحجم)
المتوسطات المتحركة
- قناة SSL
- المتوسط المتحرك المثبت
- المتوسط المتحرك بمقياس الانحراف
- مُفعّل Gann الأعلى/الأدنى
- خط الاتجاه اللحظي
- متوسط Kaufman التكيفي مع رؤية الاتجاه
- قناة المتوسط المتحرك
- مجموعة المتوسطات المتحركة
- متوسط قناة الاتجاه المتحرك
الأدوات/المخصصة
قائم على الانحدار
التقلب
المذبذبات
__________________________________________________________________________________________
إخلاء المسؤولية
التداول ينطوي على مخاطر. هذا المؤشر مخصص للتحليل الفني فقط — دائماً طبق إدارة مخاطر مناسبة وتداول بمسؤولية.
التعليقات والتحسينات
إذا كانت لديك اقتراحات، طلبات ميزات، أو أفكار لتحسين، يرجى ترك تعليق في تبويب النقاش. تساعد ملاحظاتك في تحسين المؤشر للجميع.
الملخص
Key features include configurable session start times with UTC offset adjustments, historical offset parameters for comparing past initial balance ranges, and multi-period analysis for trend confirmation. It offers optional Fibonacci retracement levels (11.4% to 88.6%) within the initial balance range to highlight mean reversion zones and precise entry or exit points. Additionally, Fibonacci projections extend upward or downward from the initial balance boundaries to indicate potential breakout targets and directional extension zones.
Line extension controls allow users to display the range during its formation, extend it to the current bar, or project it forward for planning purposes. The indicator ensures precise period detection, handling session overlaps and transitions accurately for global market analysis. This tool aids traders in identifying breakout, mean reversion, and volatility expectations based on opening range structures across all timeframes.
تقييمات العملاء
5 | 50 % | |
4 | 50 % | |
3 | 0 % | |
2 | 0 % | |
1 | 0 % |


![شعار "[Hamster-Coder] Moving Average"](https://cdn.ctrader.com/image/webp/1bd952ad-57d2-4db2-9b49-b01be0b048b8_30113)