
Описание
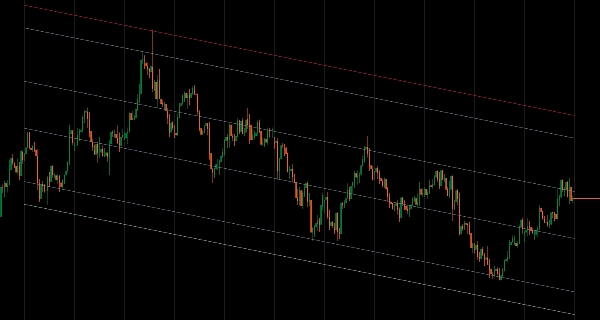
Статистические ценовые каналы с гибкими режимами расчёта и отображением полос на основе отклонений.
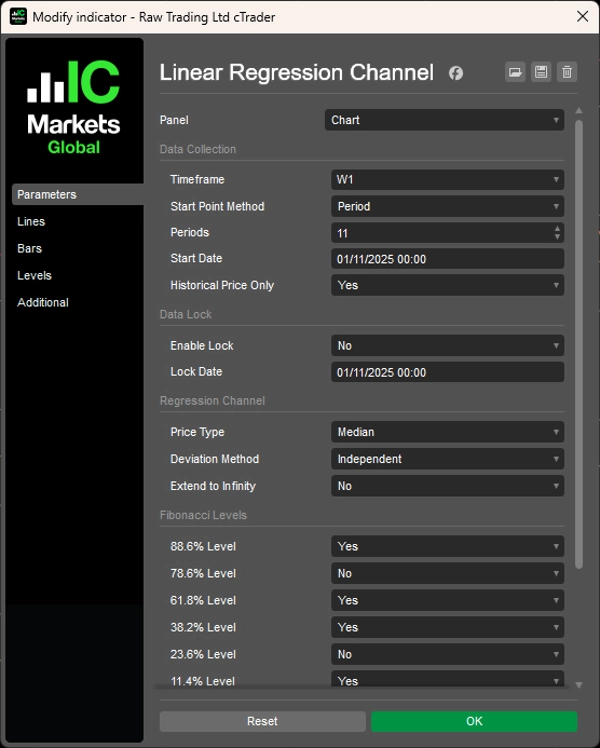
Подгоняет линии регрессии по ценовым данным, используя Режим Периода (последние N баров), Режим Даты и Времени (с определённых дат) или Механизм Блокировки для заморозки анализа в исторических точках, пока цена продолжает движение.
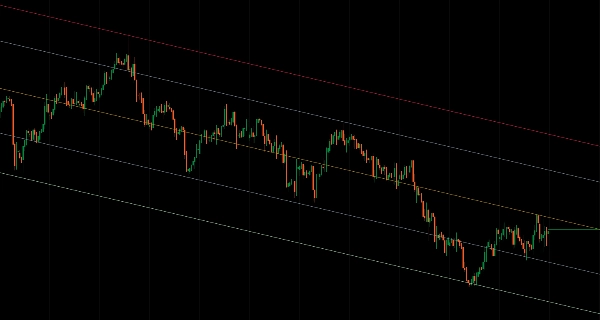
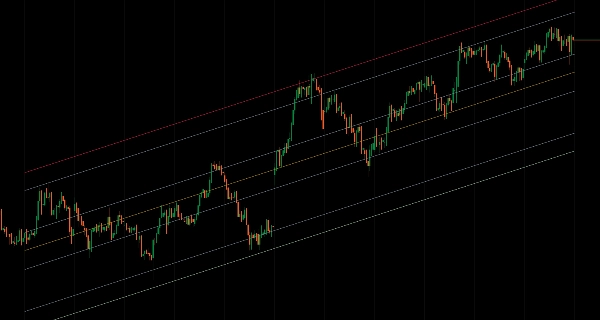
Три метода отклонений (Среднее, Независимое, Максимальное) для симметричных и асимметричных каналов, шесть уровней коррекции Фибоначчи (от 11,4% до 88,6%), мультивременной анализ, шесть типов цен (Открытие/Максимум/Минимум/Закрытие/Медиана/Типичная), режим только для истории для стабильного бэктестинга и проекция до бесконечности обеспечивают комплексный регрессионный анализ для трейдеров, ориентированных на зоны возврата к среднему и статистические ценовые границы в различных рыночных условиях.
ОСОБЕННОСТИ
Гибкий выбор данных
- Режим Периода: Анализ последних N баров (например, последние 12 месячных свечей)
- Режим Даты и Времени: Начало с определённых рыночных событий или дат
- Механизм Блокировки: Заморозка анализа в исторической точке, пока цена продолжает движение
- Мультивременной анализ: Рисование регрессии с любого таймфрейма на вашем текущем графике
Умные методы отклонений
- Среднее: Сбалансированные уровни с использованием средних отклонений — идеально для торговых зон
- Независимое: Асимметричные каналы, адаптирующиеся к направленной волатильности
- Максимальное: Показывает крайние ценовые границы для полного анализа диапазона
Профессиональные инструменты анализа
- 6 уровней коррекции Фибоначчи (11,4%, 23,6%, 38,2%, 61,8%, 78,6%, 88,6%)
- 6 типов цен: Открытие, Максимум, Минимум, Закрытие, Медиана, Типичная
- Режим только для истории: Исключение формирующихся баров для стабильного бэктестинга
- Опция продления до бесконечности для долгосрочных проекций
Полная настройка
- Полная настройка цветов для всех элементов канала
- Независимое управление линией регрессии и полосами отклонений
- Чистое визуальное оформление для сосредоточенного анализа
Расширенные возможности
- Функция блокировки для анализа на основе событий
- Комбинирование структуры старших таймфреймов с исполнением на младших
- Опции симметричных и асимметричных каналов для различных рыночных условий
__________________________________________________________________________________________
БОЛЬШЕ БЕСПЛАТНЫХ ИНДИКАТОРОВ
Исследуйте широкий спектр инструментов рыночного анализа — от структуры и объёма до регрессии, волатильности и пользовательских таймфреймов.
Исходный код доступен в репозитории на GitHub repository.
Все бесплатно для использования. Но если хотите поддержать кофе, можете сделать это здесь.
Поддержка/Сопротивление
Объём
- Volume Activity Profiler
- Volume Efficiency Analyzer
- Volume Profile Analytics
- Volume Profile - Updated
- Volume Spread Analysis
- VWAP (Volume Weighted Average Price)
Скользящие средние
- SSL Channel
- Anchored Moving Average
- Deviation-Scaled Moving Average
- Gann High Low Activator
- Instantaneous Trendline
- Kaufman Adaptive MA with Trend Vision
- Moving Average Channel
- Moving Averages Suite
- Trend Channel Moving Average
Утилиты/Пользовательские
На основе регрессии
Волатильность
Осцилляторы
__________________________________________________________________________________________
ОТКАЗ ОТ ОТВЕТСТВЕННОСТИ
Торговля связана с рисками. Этот индикатор предназначен только для технического анализа — всегда применяйте надлежащее управление рисками и торгуйте ответственно.
ОБРАТНАЯ СВЯЗЬ И УЛУЧШЕНИЯ
Если у вас есть предложения, запросы на функции или идеи для улучшения, пожалуйста, оставьте комментарий во вкладке Обсуждения. Ваш отзыв помогает улучшить индикатор для всех.
Сводка
Отзывы покупателей
5 | 100 % | |
4 | 0 % | |
3 | 0 % | |
2 | 0 % | |
1 | 0 % |


