
Beschreibung
VOLUME PROFILE AKTUALISIERTE VERSION
Im Vergleich zur vorherigen Version enthält diese aktualisierte Version wichtige Fehlerbehebungen, neue Funktionen und erhebliche Leistungsverbesserungen:
Fehlerbehebungen
- Behobene Volumenverteilung: proportionale Zuweisung basierend auf Kerzenüberlappung statt 100 % für alle berührten Niveaus
- Behobene VAH/VAL-Erkennung: Toleranz skaliert mit der Höhe des Niveaus statt fest codiertem Wert
- Behobene Textpositionierung: dynamische, zeitrahmenbasierte Versätze statt fest codierter Tage
- Behobene DateTime-Validierung: Prüfung auf leere Balken, Validierung außerhalb des Bereichs
Funktionen
- Hinzugefügter Zeitzonen-Versatzparameter für DateTime-Profile
- Hinzugefügter Textpositionsparameter (Links/Rechts) für den Rückblickmodus
- DateTime-Modusbeschriftungen folgen jetzt den Balkenkanten (variable Breite) oder richten sich am Profilrand aus (volle Breite)
Leistung
- Binäre Suche für DateTime-Indexsuche (war O(n) linear)
- Zwischengespeicherte Gesamtvolumenberechnung (wurde pro Niveau neu berechnet)
- Vorab dimensioniertes TPO-Wörterbuch zur Vermeidung von Größenänderungen
- TryGetValue-Muster für Wörterbuchabfragen
- Indexbasierte Schleifen ersetzen foreach in kritischen Pfaden
Bereinigung
- Entfernter ProfileWidth-Parameter (automatisch berechnet ist immer korrekt)
- Vereinfachte Kerzenüberschneidung auf eine einzelne Bedingung
__________________________________________________________________________________________
WICHTIGE HINWEISE - ZUERST LESEN
Forex-Volumen ist kein echtes Volumen
Volumen im Forex ist Tick-Volumen – es zählt, wie oft sich der Preis ändert. Es zählt NICHT, wie viel Geld gehandelt wurde.
Was Tick-Volumen nicht zeigen kann
- Handelsgröße. Ein $100-Trade und ein $10.000.000-Trade zählen beide als 1 Tick.
- Echter Geldfluss. Sie können nicht sehen, ob großes oder kleines Geld den Preis bewegt hat.
- Wahre Liquidität. Sie können nicht sehen, wie viele Aufträge im Markt warten.
- Bankaktivität. Banken sehen echte Volumendaten. Sie nicht.
Was das bedeutet
Tick-Volumen zeigt nur, wie oft sich der Preis geändert hat – nicht das dahinterstehende Geld. Das führt zu Problemen:
- Sie können Banken oder Institutionen nicht verfolgen. Sie verwenden echte Volumendaten, auf die Sie keinen Zugriff haben.
- Sie können „Smart Money“-Theorien nicht beweisen. Diese Ideen benötigen echtes Volumen, keine Tick-Zählungen.
- Sie können wahre Liquidität nicht beurteilen. Tick-Aktivität zeigt keine Auftrags-Tiefe oder echte Marktstärke.
- Sie können echte Kauf- oder Verkaufskraft nicht messen. Viele kleine Trades sehen gleich aus wie ein großer institutioneller Trade.
- Volumenspitzen können täuschen. Eine Spitze könnte nur algorithmisches Rauschen sein, kein echtes Handelsinteresse.
Wie man diesen Indikator richtig verwendet
- Betrachten Sie ihn als Aktivitätsmesser, nicht als Geldmesser. Hohes Tick-Volumen = Markt ist beschäftigt. Niedriges Tick-Volumen = Markt ist ruhig. Nicht mehr.
- Vergleichen Sie die Aktivität zwischen verschiedenen Zeiten. Nutzen Sie ihn, um zu sehen: Ist die Londoner Sitzung geschäftiger als New York? Ist heute aktiver als gestern? Ist die Trendperiode geschäftiger als die Konsolidierung?
- Kombinieren Sie ihn mit der Preisstruktur. Verwenden Sie Unterstützung/Widerstand, Swing-Punkte oder BOS/ChoCH zusammen mit Volumen. Der Preiskontext verhindert falsche Signale durch laute Volumenspitzen.
- Beobachten Sie die Aktivität an wichtigen Preisniveaus. Wenn der Preis ein Schlüsselniveau testet und das Tick-Volumen steigt, bedeutet das, dass mehr Händler aktiv sind. Es bedeutet NICHT, dass große Akteure beteiligt sind.
- Gehen Sie nicht davon aus, dass es institutionelle Aktivität zeigt. Tick-Volumen kann keine Akkumulation, große Aufträge oder „Smart Money“ zeigen. Verwenden Sie es nur, um Rhythmus und Tempo zu messen.
__________________________________________________________________________________________
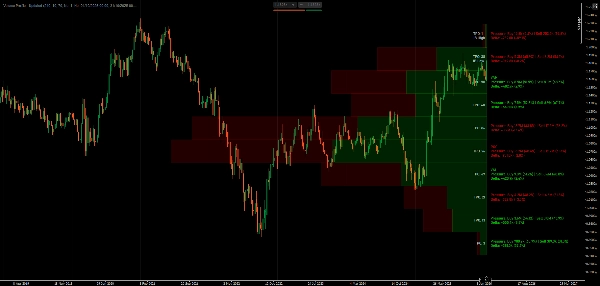
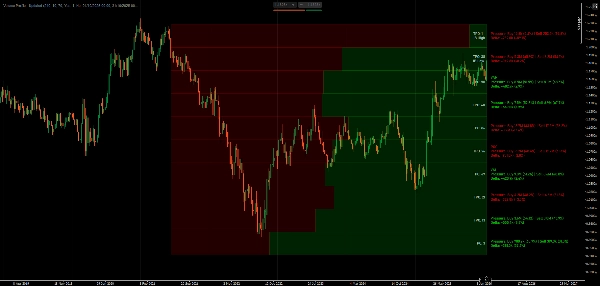
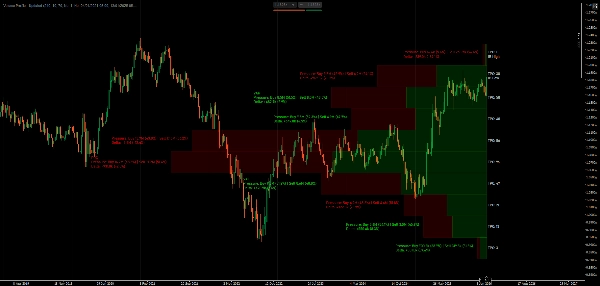
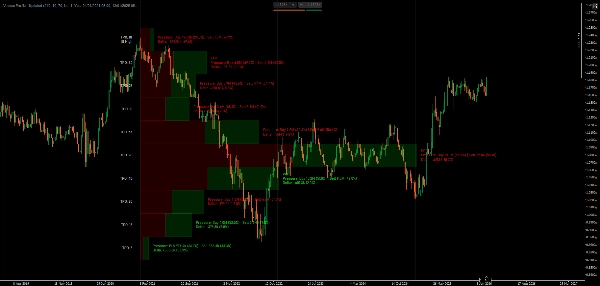
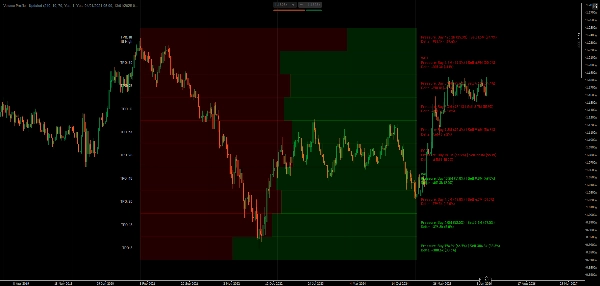
Visualisieren Sie Volumenverteilung und Zeit-am-Preis mit POC, Value Area und Market Profile TPO-Tracking.
Dieser Indikator zeigt die Volumenverteilung unter Verwendung von Market Profile-Konzepten. Er zeigt den Point of Control (höchstes Tick-Aktivitätsniveau), Value Area-Grenzen (wo der meiste Handel stattfand), TPO-Buchstabenfolgen (verbrachte Zeit bei jedem Preis) und Delta-Visualisierung, die die Tick-Aktivität nach Kerzenrichtung aufteilt.
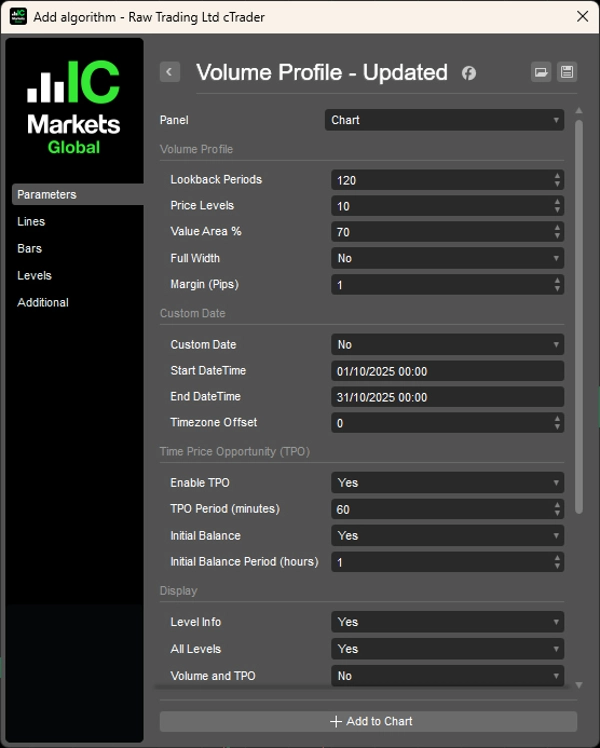
Sie können Rückblickperioden wählen oder spezifische Datumsbereiche einstellen, Volumenbalken proportional oder in voller Breite anzeigen, zwischen allen Niveaus oder nur Schlüsselniveaus umschalten und Farben für bullische/bärische Aktivität anpassen.
FUNKTIONEN
Analyse der Volumenverteilung
- Point of Control (POC): Preisniveau mit der höchsten Aktivität – wo der Preis die meiste Zeit verbrachte
- Value Area (VA): Anpassbarer Bereich der Aktivitätskonzentration (Standard 70 %) – wo der meiste Handel stattfand
- VAH/VAL: Value Area High/Low-Grenzen – potenzielle Unterstützungs-/Widerstandsniveaus
- Delta-Visualisierung: Geteilte Balken zeigen Kerzenrichtung auf jedem Preisniveau
Market Profile TPO
- Time Price Opportunity Tracking: Zählt, wie viele Zeitperioden bei jedem Preis gehandelt wurden
- TPO-Buchstaben: Visuelle Darstellung der verbrachten Zeit am Preis (A-Z-Sequenz)
- Initial Balance (IB): Bereich der ersten Stunde – wichtig für Tageshandelsstruktur
- IB High/Low-Markierungen: Extremwerte des Eröffnungsbereichs
Flexible Rückblickoptionen
- Periodenbasiert: Anzahl der zu analysierenden Balken festlegen (z. B. letzte 120 Balken)
- DateTime-Bereich: Profil zwischen bestimmten Daten/Zeitpunkten für Ereignisanalyse verankern
- Dynamische Breite: Automatische Skalierung oder feste Breite der Profile
Anzeigeoptionen
- Volumenbalken: Proportionale Breite (aktivitätsabhängig skaliert) oder vollflächige einheitliche Balken
- Kerzenrichtungsaufteilung innerhalb jedes Balkens
- Delta-Berechnungen mit Prozentangaben
- Umschalten zwischen allen Niveaus oder nur Schlüsselniveaus (POC, VAH, VAL)
- Sichtbarkeitssteuerung für Volumen-/TPO-Details
- Richtungsaufteilung mit Prozentangaben
- Anpassbare Schriftgröße und pip-basierte Ränder
Farbanpassung
- Unabhängige Farben für bullische/bärische Richtungsbalken
- Separate Textfarben für positive/negative Delta-Werte
- TPO-spezifische Textfarbe
Leistungsoptimiert
- Zwischengespeicherte Zeitabfragen und effizientes Rechteckzeichnen
- Minimale Neuberechnung für flüssige Leistung
- Professionelle Delta-Berechnung basierend auf Kerzenstruktur
__________________________________________________________________________________________
MEHR KOSTENLOSE INDIKATOREN
Entdecken Sie eine breite Palette von Marktanalysetools – von Struktur und Volumen bis Regression, Volatilität und benutzerdefinierten Zeitrahmen.
Quellcode ist im GitHub Repository verfügbar.
Alle kostenlos nutzbar. Aber wenn Sie Kaffee-Support senden möchten, können Sie ihn hierhinleiten.
Support/Widerstand
Volumen
- Volumenaktivitätsprofiler
- Volumeneffizienz-Analysator
- Volumenprofil-Analyse
- Volumenprofil - Aktualisiert
- Volumen Spread Analyse
- VWAP (Volumen-Gewichteter Durchschnittspreis)
Gleitende Durchschnitte
- SSL-Kanal
- Verankerter gleitender Durchschnitt
- Abweichungsskaliertes gleitendes Mittel
- Gann High Low Aktivator
- Sofortige Trendlinie
- Kaufman Adaptive MA mit Trend Vision
- Gleitender Durchschnittskanal
- Gleitende Durchschnitte Suite
- Trendkanal gleitender Durchschnitt
Dienstprogramme/Benutzerdefiniert
Regressionsbasiert
Volatilität
Oszillatoren
__________________________________________________________________________________________
HAFTUNGSAUSSCHLUSS
Der Handel ist mit Risiken verbunden. Dieser Indikator ist nur für die technische Analyse gedacht – wenden Sie stets ein angemessenes Risikomanagement an und handeln Sie verantwortungsbewusst.
FEEDBACK & VERBESSERUNGEN
Wenn Sie Vorschläge, Funktionswünsche oder Ideen zur Verbesserung haben, hinterlassen Sie bitte einen Kommentar im Diskussions-Tab. Ihr Feedback hilft, den Indikator für alle zu verbessern.
Zusammenfassung
Key features include customizable lookback periods based on bar count or specific date/time ranges, dynamic or fixed profile widths, and display options for proportional or full-width volume bars. Users can toggle visibility of all levels or key levels (POC, VAH, VAL) and adjust colors independently for bullish/bearish bars and delta text. The indicator tracks Initial Balance (IB) ranges and marks IB High/Low for day trading structure.
Performance optimizations include binary search for DateTime lookups, cached volume calculations, and efficient data structures to minimize recalculations. The indicator uses tick volume, which counts price changes rather than actual traded volume, making it suitable as a market activity meter rather than a measure of real money flow or liquidity.
Supported markets include Forex, Indices, Commodities, Crypto, and Stocks. The indicator is intended for technical analysis and includes parameters for timezone offset and text positioning.
Kundenbewertungen
5 | 100 % | |
4 | 0 % | |
3 | 0 % | |
2 | 0 % | |
1 | 0 % |


