
Engulfing Pattern Indicator
Indikator
463 muat turun
Versi 1.0, Mar 2025
Windows, Mac
4.0
Ulasan: 1
Sejak 21/02/2025
466.3M
Volum yang didagangkan
180.83K
Pip dimenangi
22
Jualan
6.92K
Pemasangan percuma
Penerangan
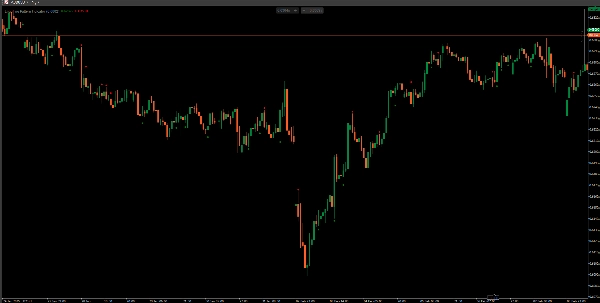
Penunjuk Corak Engulfing – Penerangan
Penunjuk Corak Engulfing mengesan corak lilin engulfing bullish dan bearish, yang menandakan kemungkinan pembalikan arah aliran.
Cara Ia Berfungsi
🔍 Engulfing Bullish:
- Lilinnya sebelumnya adalah bearish (tutup < buka).
- Lilinnya semasa adalah bullish (tutup > buka).
- Lilinnya bullish menelan badan lilin sebelumnya (buka < tutup sebelumnya & tutup > buka sebelumnya).
- Penanda hijau dilukis di bawah corak.
🔍 Engulfing Bearish:
- Lilinnya sebelumnya adalah bullish (tutup > buka).
- Lilinnya semasa adalah bearish (tutup < buka).
- Lilinnya bearish menelan badan lilin sebelumnya (buka > tutup sebelumnya & tutup < buka sebelumnya).
- Penanda merah dilukis di atas corak.
Ciri-ciri Utama
✅ Mengenal pasti isyarat pembalikan yang kuat dalam tindakan harga.
✅ Berfungsi pada semua jangka masa dan pasaran (Forex, Saham, Kripto).
✅ Membantu pedagang mengenal pasti setup perdagangan berkemungkinan tinggi pada tahap utama.
📌 Penggunaan Terbaik: Gabungkan dengan sokongan/rintangan dan analisis trend untuk ketepatan yang lebih tinggi! 🚀
Ringkasan
Ringkasan AI
The Engulfing Pattern Indicator identifies bullish and bearish engulfing candlestick patterns, which are signals of potential trend reversals in price action. It works by detecting when a current candle fully engulfs the body of the previous candle under specific conditions:
- Bullish Engulfing occurs when a bearish candle is followed by a larger bullish candle that engulfs the previous candle’s body. A green marker is plotted below this pattern.
- Bearish Engulfing occurs when a bullish candle is followed by a larger bearish candle that engulfs the previous candle’s body. A red marker is plotted above this pattern.
This indicator operates across all timeframes and markets, including Forex, Stocks, and Crypto. It helps traders identify strong reversal signals and high-probability trade setups at key levels. For improved accuracy, it is recommended to use this indicator in combination with support/resistance and trend analysis.
Profil indikator
Ulasan pelanggan
4.0
Ulasan: 1
5 | 0 % | |
4 | 100 % | |
3 | 0 % | |
2 | 0 % | |
1 | 0 % |
Ulasan pelanggan
August 12, 2025
Pros: Accurate detection of bullish and bearish engulfing patterns, customizable settings, stable performance. Cons: No alerts, no MTF mode, no trade statistics.
Perbincangan
Soalan Lazim
Forex
Signal
Crypto
Stocks
Produk yang tersedia melalui cTrader Store, termasuk bot dagangan, indikator dan plugin, disediakan oleh pembangun pihak ketiga dan diberikan akses untuk tujuan maklumat dan teknikal sahaja. cTrader Store bukan broker dan tidak memberikan nasihat pelaburan, syor peribadi atau sebarang jaminan prestasi masa hadapan.


Harga
Sejak 21/02/2025
466.3M
Volum yang didagangkan
180.83K
Pip dimenangi
22
Jualan
6.92K
Pemasangan percuma