
Penerangan
Market Cipher A adalah penunjuk teknikal lanjutan yang direka untuk analisis mudah, pengenalpastian, dan ramalan trend makro dalam pasaran kriptowang.
Struktur dan Komponen
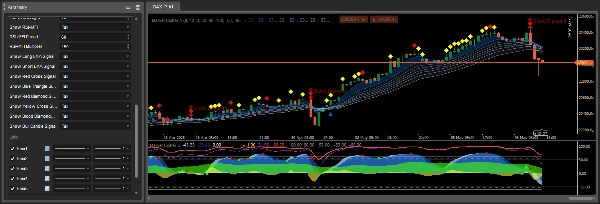
Market Cipher A terdiri daripada reben 8 purata bergerak eksponen (EMA) yang berubah warna bergantung pada trend pasaran. Reben EMA bertukar biru atau putih semasa pasaran lembu dan kelabu semasa pasaran beruang.
Secara lalai, purata bergerak dengan nilai EMA dari 5 hingga 34 digunakan. Persilangan garis-garis ini boleh menjadi penunjuk kelewatan yang sangat kuat, sebab itu Market Cipher A telah diprogram untuk secara automatik memaparkan simbol yang sepadan dengan isyarat yang berbeza, menghapuskan keperluan untuk tafsiran manual setiap persilangan bullish atau bearish.
Simbol dan Isyarat Perdagangan
Market Cipher A memaparkan simbol ciri terus pada carta candlestick yang menunjukkan peluang perdagangan yang berpotensi:
Segitiga Biru - isyarat pembalikan trend, menunjukkan momentum menurun dan pembalikan yang akan datang. Ia adalah amaran awal bahawa momentum trend sedang berkurangan.
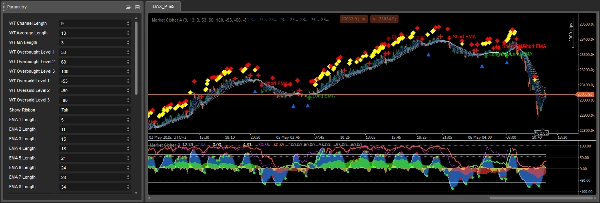
Bulatan Hijau - penunjuk bullish, paling boleh dipercayai pada jangka masa 6 jam dan ke atas. Biasanya muncul selepas segitiga biru dan harus ditafsirkan dalam julat 1-3 lilin.
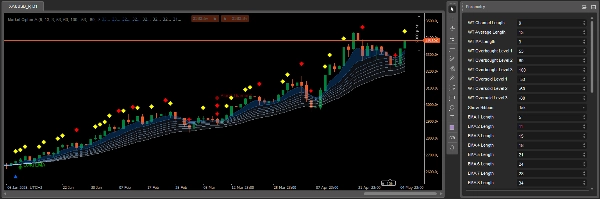
Berlian Kuning - menunjukkan kesinambungan trend menaik. Harus digunakan bersama reben EMA untuk pengesahan arah trend yang lebih baik.
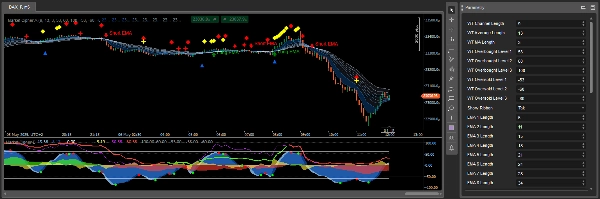
Berlian Merah - menandakan kelemahan trend dan kemungkinan kesinambungan ke bawah. Menunjukkan peningkatan momentum ke bawah.
X Merah - penunjuk bearish, paling berkesan pada jangka masa 1 jam dan ke atas. Harus digunakan bersama reben EMA dan berlian merah.
X Kuning - menunjukkan manipulasi pasaran, terutamanya penutupan posisi panjang besar yang cepat dibeli dan dijual oleh posisi pendek.
Berlian Merah Besar (Berlian Darah) - isyarat paling bearish, menunjukkan kebarangkalian tinggi penurunan, terutamanya apabila berlaku bersama X merah atau berlian merah yang lebih kecil.
Prinsip Penggunaan
Market Cipher A menyediakan sokongan atau rintangan matematik yang kuat secara visual, membolehkan pemahaman mudah tentang persekitaran perdagangan. Ia berfungsi terbaik dengan lilin Heiken Ashi.
Reben EMA bukan sahaja menunjukkan trend tetapi juga bertindak sebagai tahap sokongan dan rintangan dinamik. Apabila reben berwarna biru/putih dan lilin berada di atasnya, anda boleh mencari peluang untuk mengambil posisi panjang. Apabila reben berwarna kelabu dan lilin berada di bawahnya, anda boleh mempertimbangkan posisi pendek.
Keputusan terbaik dicapai apabila isyarat dari Market Cipher A digabungkan dengan penunjuk lain dari pakej Market Cipher, terutamanya Market Cipher B, yang menyediakan isyarat momentum tambahan dan titik masuk.
Tafsiran Isyarat Terperinci dalam Konteks Trend
Aspek penting Market Cipher A adalah tafsiran isyarat kontekstual bergantung pada trend dominan. Apabila reben berubah warna dari kelabu ke biru, penunjuk menghasilkan bulatan hijau sebagai isyarat permulaan trend menaik. Biasanya, selepas bulatan hijau, jika 1-3 lilin berikut memaparkan berlian kuning, kebarangkalian pecahan tinggi. Namun, jika berlian merah muncul, pecahan kurang mungkin.
Semasa pasaran lembu, berlian kuning adalah menguntungkan, menunjukkan kesinambungan ke atas selaras dengan trend, manakala berlian merah mewakili pergerakan bertentangan dengan trend. Dalam pasaran beruang, situasi adalah terbalik - berlian merah menguntungkan sebagai kesinambungan penurunan, dan berlian kuning menunjukkan pergerakan naik sementara bertentangan dengan trend.
X merah paling boleh dipercayai apabila ia muncul selepas berlian merah dan reben EMA hampir sepenuhnya mengecil, berubah warna menjadi kelabu bearish. Ketepatan penunjuk ini berbeza bergantung pada jangka masa.
Mekanisme Operasi dan Genesis Isyarat
Simbol dan isyarat dalam Market Cipher A dijana berdasarkan beberapa sumber: persilangan gelombang WaveTrend, tahap terlebih beli dan terlebih jual, dan berdasarkan RSI dan MFI apabila mereka melintasi garis tengah atau mencapai keadaan terlebih beli dan terlebih jual. Analisis multidimensi ini menjadikan isyarat lebih menyeluruh daripada penunjuk tunggal.
Reben EMA terdiri daripada 8 purata bergerak yang membentuk reben ciri dengan pemisahan antara jalur individu. Pemisahan jalur adalah faktor penting - pemisahan lebar menunjukkan trend kuat, manakala jalur yang mengecil menunjukkan momentum yang melemah atau konsolidasi.
Aplikasi Praktikal dalam Strategi Perdagangan
Market Cipher A direka terutamanya sebagai alat analisis trend, jadi ia berfungsi terbaik dalam strategi mengikuti trend. Disyorkan untuk menggunakan reben bersama penunjuk pengenalpastian trend lain, kemudian mencari peluang perdagangan semasa penarikan balik harga.
Penting untuk diingat bahawa isyarat ini membantu memperhalusi masa masuk atau keluar dari perdagangan, tetapi tidak harus digunakan sendiri untuk membuat keputusan perdagangan. Pengesahan tambahan diperlukan, terutamanya untuk isyarat pembalikan yang berlaku semasa pergerakan harga mendatar.
Ringkasan
The indicator automatically displays distinct symbols on the price chart to signal potential trading opportunities:
- Blue Triangle: signals declining momentum and possible trend reversal.
- Green Circle: indicates a bullish trend start, most reliable on 6-hour timeframes and above.
- Yellow Diamonds: suggest continuation of an upward trend.
- Red Diamonds: indicate trend weakening and potential downward continuation.
- Red X: bearish signal effective on 1-hour timeframes and higher.
- Yellow X: points to market manipulation events.
- Large Red Diamond ("Blood Diamond"): strong bearish signal with high probability of decline.
Signals are generated using a combination of WaveTrend crossovers, RSI, and MFI indicators, providing multidimensional market analysis. Market Cipher A is optimized for use with Heiken Ashi candles and is best applied within trend-following strategies, ideally combined with other Market Cipher indicators for enhanced entry and momentum confirmation.
Ulasan pelanggan
5 | 67 % | |
4 | 33 % | |
3 | 0 % | |
2 | 0 % | |
1 | 0 % |


![Logo "[Hamster-Coder] Moving Average MTF"](https://cdn.ctrader.com/image/webp/b11b98b1-194d-4b8e-b00e-d611826ad159_31226)


