
설명
BUBBLEXRAY — CTRADER를 위한 궁극의 버블 볼륨 엑스레이 ( 🇧🇷 버전 아래에 있음)
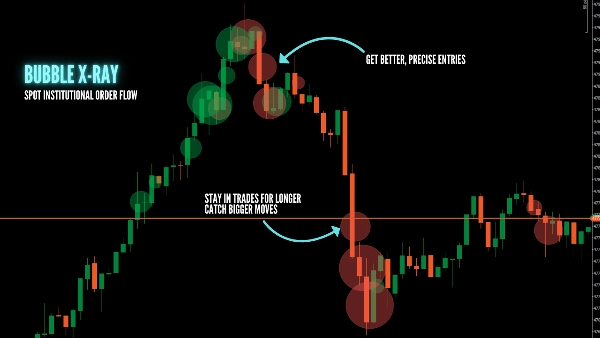
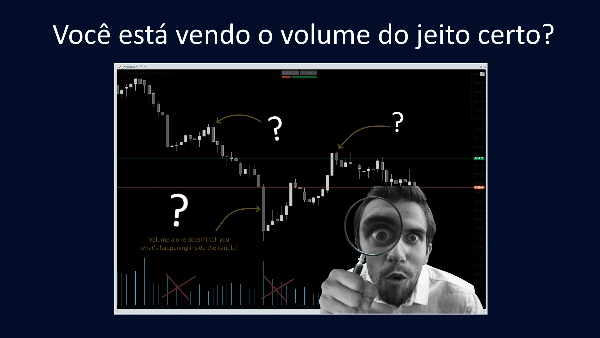
진짜 돈이 움직이는 곳을 포착하세요. BubbleXRay 는 고거래량 급증을 식별하고 이를 가격 움직임 위에 비례하는 버블로 직접 표시합니다. 누적 거래량 델타(CVD) 변화를 단일 지표에 통합하여 차트를 복잡하거나 어지럽히지 않습니다. 더 이상 추측하지 마세요—기관의 흔적을 발생하는 순간 바로 확인하세요.
✅ BUBBLEXRAY를 사용하는 이유?
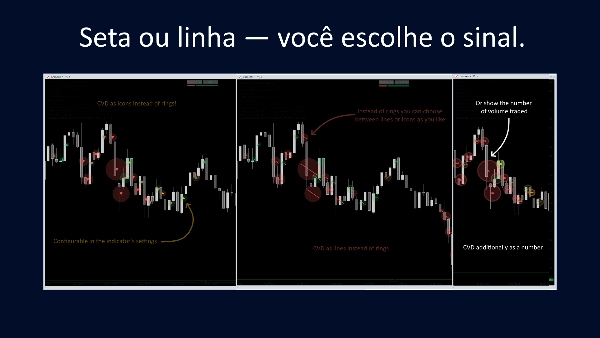
- 즉각적인 활동 급증: 고거래량 바가 닫히는 순간 버블이 형성됩니다.
- 기관의 흔적: 주요 레벨에서 큰 버블은 큰 플레이어가 활동하는 위치를 보여줍니다.
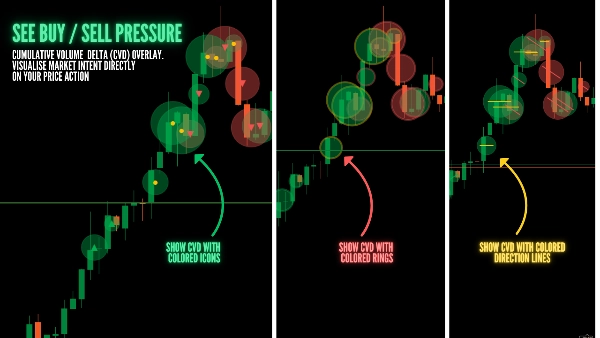
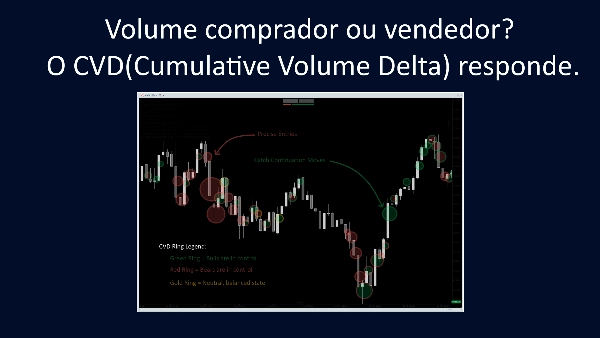
- CVD 인텔리전스: 통합된 누적 거래량 델타는 급증이 매수 압력인지 매도 압력인지 보여줍니다.
- 자동 스케일링: 롤링 백분위 윈도우는 모든 시장 상황(추세 또는 횡보)에 적응합니다.
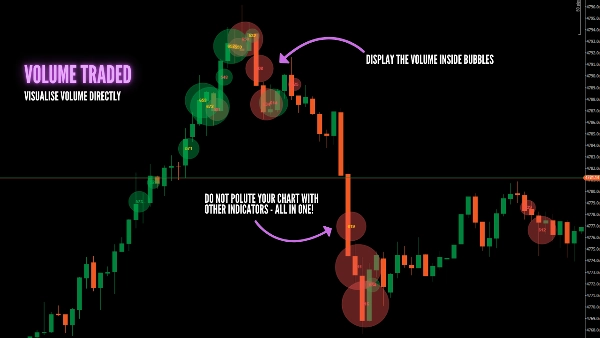
- 가격 고정: 거래량은 하위 창 히스토그램에 숨겨지지 않고 정확한 가격 레벨에 표시됩니다.
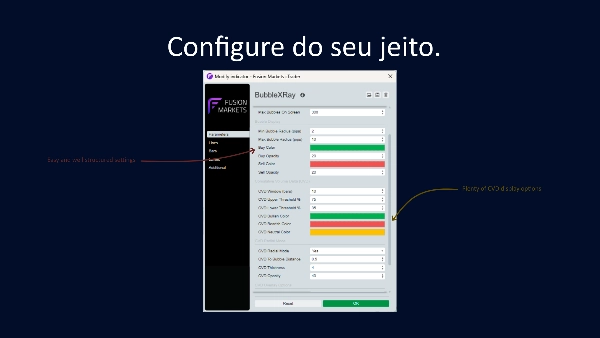
프리셋 예시: 골드 (XAUUSD) - 1분 차트
- 거래량 백분위 임계값: 80
- 백분위 윈도우 (바): 250
- 화면상의 최대 버블 수: 20
- 최소 버블 반경 (핍): 5
- 최대 버블 반경 (핍): 20
- CVD 롤링 기간 (바): 10
- CVD 기울기 조회 기간 (바): 7
- CVD 평탄 계수: 1.8
- CVD 방사형 모드: 아니요
- CVD에서 버블까지 거리: 0.5
- CVD 두께: 4
- CVD 불투명도: 40
- CVD 오버레이 옵션: 아니요
- 디버그 모드: 아니요
📺 튜토리얼 시청 및 커뮤니티 참여:
(커뮤니티 성장을 위해 질문이나 지원 요청은 영상 댓글에 남겨주세요!)
🛠️ 주요 기능:
- 비례 크기 조절: 버블 크기는 거래량 크기에 따라 선형으로 조절됩니다.
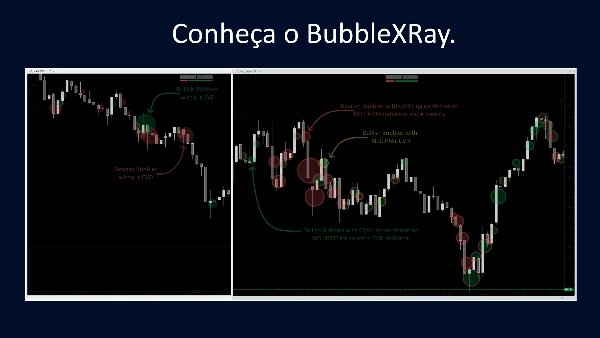
- 이중 확인: 방사형 링과 오버레이 화살표를 결합하여 더 깊은 CVD 컨텍스트를 제공합니다.
- 무설정: 차트에 가장 적합한 데이터 피드 타임프레임을 자동으로 선택합니다.
- 깔끔한 UI: 불투명도 및 표시 한도를 구성하여 차트를 전문적으로 유지합니다.
🇧🇷 BUBBLEXRAY — CTRADER를 위한 궁극의 볼륨 엑스레이
"스마트 머니"가 활동하는 위치를 식별하세요. BubbleXRay 는 가격에 직접 비례하는 버블로 고거래량 급증을 표시합니다. 누적 거래량 변화(CVD)를 단일 지표에 통합하여 차트를 복잡하게 하지 않습니다. 더 이상 의심하지 마세요: 기관의 흔적을 발생하는 순간 바로 확인하세요.
✅ 왜 BUBBLEXRAY를 사용해야 하나요?
- 즉각적인 활동 급증: 고거래량 바가 닫히는 즉시 버블이 나타납니다.
- 기관의 흔적: 주요 레벨에서 큰 버블은 큰 플레이어의 활동을 드러냅니다.
- CVD 인텔리전스: 통합된 누적 거래량 델타는 매수 또는 매도 압력 여부를 보여줍니다.
- 자동 조정: 백분위 시스템은 모든 시장 상황(추세 또는 횡보)에 적응합니다.
- 가격 고정: 거래량은 하위 히스토그램에 숨겨지지 않고 정확한 가격 수준에 표시됩니다.
📺 튜토리얼 시청 및 질문하세요:
(커뮤니티를 최대한 돕기 위해 위 영상 댓글에 질문 및 지원 요청을 남겨주세요!)
🛠️ 기술적 특징:
- 비례 크기: 버블 크기는 거래량 크기에 따라 선형으로 조절됩니다.
- 이중 확인: 방사형 링과 내부 화살표를 결합하여 더 깊은 CVD 컨텍스트를 제공합니다.
- 무설정: 차트에 가장 적합한 데이터 피드 타임프레임을 자동으로 선택합니다.
- 깔끔한 UI: 불투명도 및 표시 한도를 구성하여 전문적인 차트를 유지합니다.
요약
AI 요약
BubbleXRay is a volume-based trading indicator designed for the cTrader platform that visualizes institutional order flow through proportional volume bubbles directly on price charts. It highlights high-volume spikes as bubbles sized according to volume magnitude, enabling traders to identify where significant market participants are active. The indicator integrates Cumulative Volume Delta (CVD) data to distinguish buying versus selling pressure, providing deeper insight into volume dynamics without cluttering the chart. Key features include instant detection of volume spikes upon bar close, auto-scaling via a rolling percentile window adaptable to trending or ranging markets, and price-anchored volume display rather than separate histograms. Additional functionalities include dual confirmation using radial rings and overlay arrows for enhanced CVD context, zero-configuration automatic timeframe selection, and customizable opacity and display limits for a clean user interface. The indicator supports analysis of key market structure concepts such as key levels, liquidity sweeps, imbalances, supply and demand zones, and support/resistance. A preset example configuration is provided for Gold (XAUUSD) on a 1-minute chart. A tutorial video is available to assist users in setup and application. BubbleXRay requires volume and tick data and outputs visual signals directly on price charts.
지표 프로필
지표 카테고리
거래량
출력 유형
시각화
데이터 요구 사항
거래량
틱 데이터
막대만
고객 리뷰
4.0
리뷰: 2
5 | 0 % | |
4 | 100 % | |
3 | 0 % | |
2 | 0 % | |
1 | 0 % |
고객 리뷰
April 20, 2026
It becomes more useful when it makes overtrading easier to notice. Size control still matters.
April 16, 2026
The first 10 trades should stay boring. Bad setups become easier to pass on, and the chart still needs a final look.
상담
자주 묻는 질문(FAQ)
Key Levels
Liquidity Sweep
Imbalance
Volume
Supply & Demand
Liquidity Grab
Support & Resistance
트레이딩 봇, 지표, 플러그인 등 cTrader Store에서 제공되는 상품은 제3자 개발자에 의해 제공되며, 이는 단순히 정보 및 기술적 접근을 목적으로 제공된 것입니다. cTrader Store는 중개인이 아니며, 투자 조언, 개인별 추천 또는 향후 성과에 대한 어떠한 보장도 제공하지 않습니다.
이 작성자의 상품 더 보기


가격
가입일 09/02/2026
15
판매
116
무료 설치