
Frac Support Resistance V1
지표
2 구매
버전 1.0, Nov 2025
Windows, Mac
5.0
리뷰: 1
설명
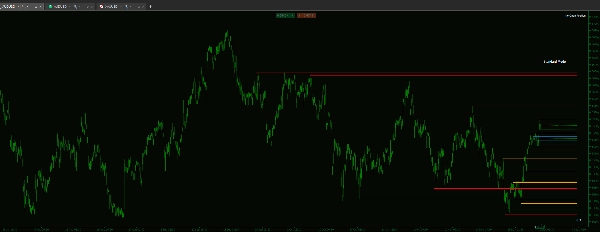
만약 당신이 시장 구조를 기반으로 거래한다면, 가장 중요한 수준들이 종종 더 높은 시간대에 설정된다는 것을 알고 있을 것입니다. 이 맞춤형 지표는 이러한 수준들을 수동으로 식별하고 추적하는 번거로움을 해결해줍니다.
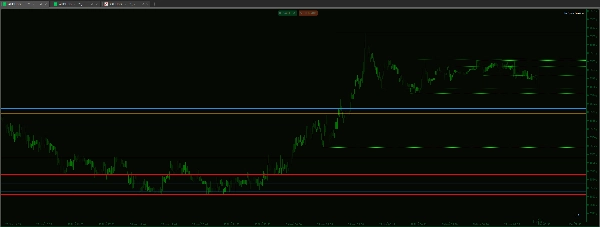
이 도구는 신뢰할 수 있는 시각적 계층 구조를 제공하도록 설계되어, 실행 화면을 벗어나지 않고도 중요한 구조적 경계와 고가치 영역을 우선순위로 볼 수 있도록 보장합니다.
주요 기능 및 세밀한 제어
- 이 지표는 뛰어난 성능과 깔끔한 차트 시각화를 위해 제작되었습니다:
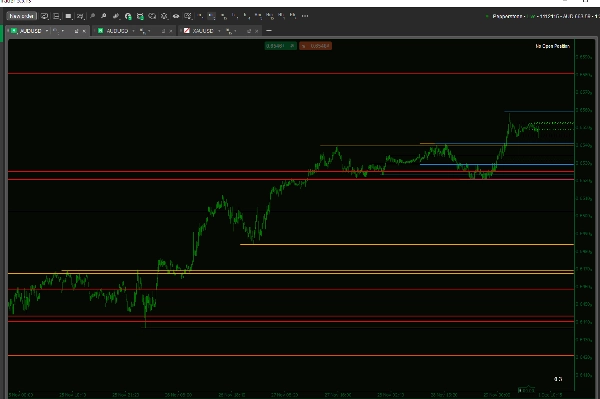
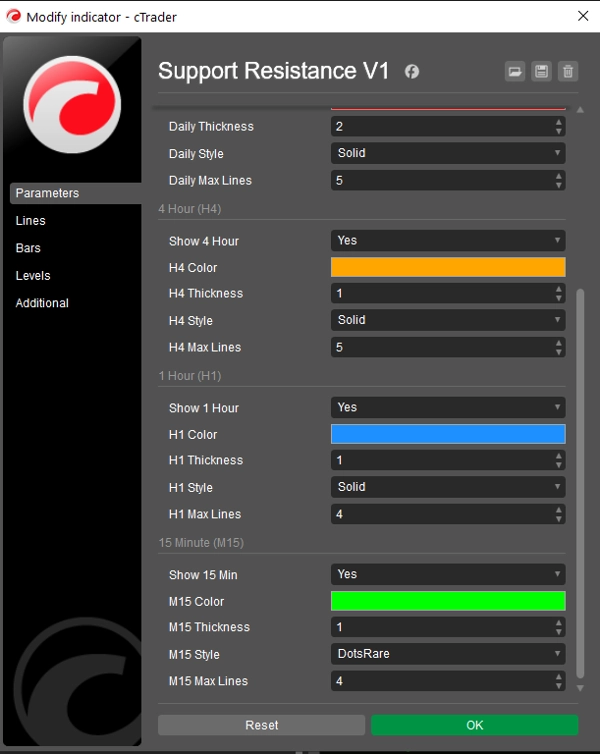
- 진정한 시각적 계층 구조: 각 시간대별로 두께, 선 스타일(실선, 대시, 점선), 색상을 독립적으로 제어할 수 있습니다.
- 장점: 단지 외관만으로도 수준의 강도를 즉시 인식할 수 있습니다(예: 주요 구조를 위해 D1 선을 두껍고 실선으로 설정하고, 즉각적인 수준을 위해 H1 선을 얇고 점선으로 설정).
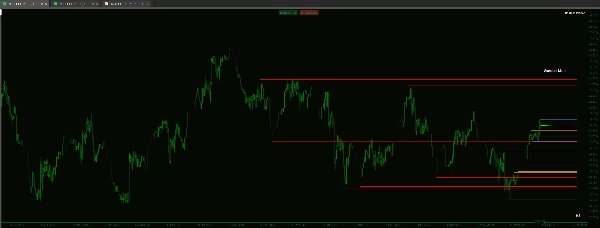
- 성능 및 집중 제어: 복잡한 차트에 지치셨나요? 각 시간대별로 표시되는 최대 선 수를 개별적으로 제한할 수 있습니다.
- 예시: H4 최대 선 수를 5로, D1 최대 선 수를 15로 설정하여 낮은 시간대의 최근 수준을 우선시하면서 주요 구조의 더 깊은 뷰를 유지합니다.
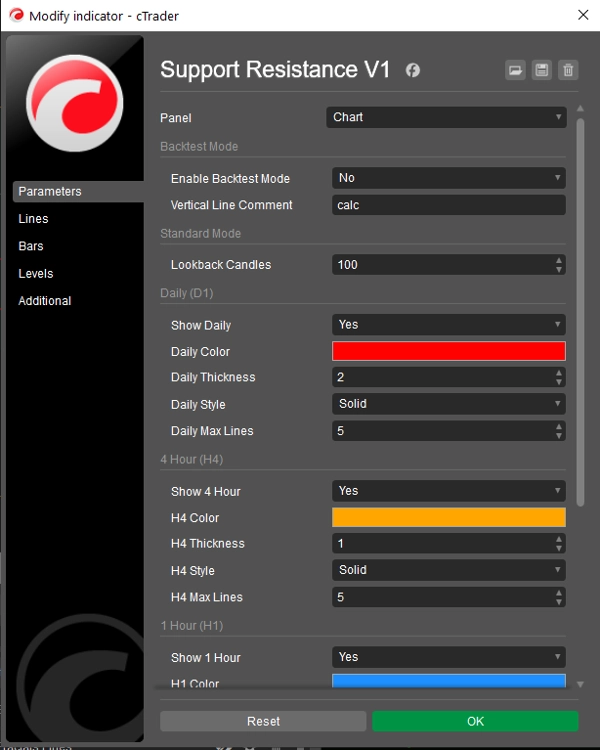
- 깔끔한 코드 기반: 신뢰할 수 있는 프랙탈 논리를 기반으로 하여, 식별된 수준이 표준 구조 분석에 사용되는 진정한 고점/저점 피벗임을 보장합니다.
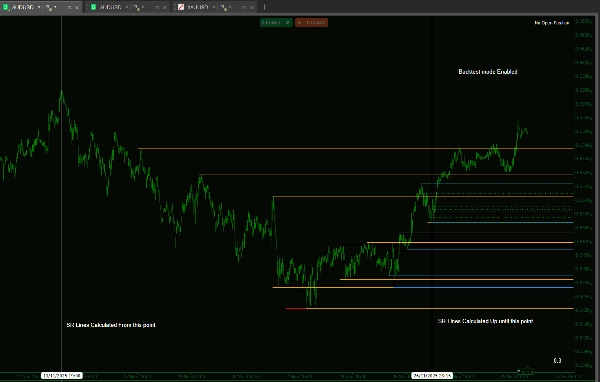
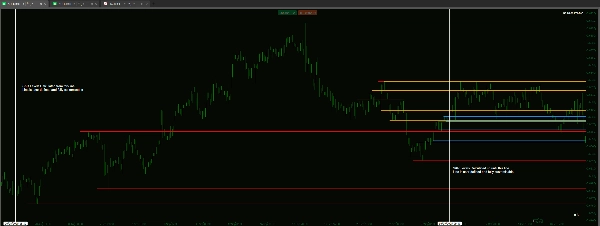
- 전용 백테스팅 모드: 차트에서 특정 정의된 시간 범위로 지표 분석을 제한하는 기능을 포함합니다. 이는 미래 편향 없이 시간 진행을 시뮬레이션하여 정확한 수동 백테스팅에 필수적입니다.
요약
AI 요약
Frac Support Resistance V1 is a technical indicator designed to automatically calculate and display smart support and resistance lines derived from multiple timeframes: daily (D1), 4-hour (H4), hourly (H1), and 15-minute (M15). It assists traders who rely on market structure by visually highlighting critical price levels established on higher timeframes, reducing the need for manual identification.
Key features include customizable visual hierarchy, allowing independent adjustment of line thickness, style (solid, dashed, dotted), and color for each timeframe. This enables quick recognition of the relative strength of support and resistance levels. Users can also control chart clarity by setting maximum numbers of lines per timeframe to prioritize recent or major structural levels.
The indicator is based on fractal logic to identify genuine high and low pivots consistent with standard market structure analysis. It includes a dedicated backtesting mode that restricts analysis to a specified historical period, facilitating unbiased manual strategy testing by simulating real-time progression.
Frac Support Resistance V1 supports various markets including Forex, cryptocurrencies, commodities, indices, and stocks, with tags indicating compatibility with symbols like BTCUSD, EURUSD, GBPUSD, XAUUSD, NAS100, and USDJPY. The tool is suited for strategies involving breakout, scalping, smart money concepts, and grid trading.
지표 프로필
고객 리뷰
5.0
리뷰: 1
5 | 100 % | |
4 | 0 % | |
3 | 0 % | |
2 | 0 % | |
1 | 0 % |
고객 리뷰
December 1, 2025
A small account test feels safer, and the plan becomes easier to stick with, and the chart still needs a final look.
상담
자주 묻는 질문(FAQ)
BTCUSD
Forex
Signal
Breakout
Indices
EURUSD
Commodities
GBPUSD
NZDUSD
Prop
Scalping
SMC
Crypto
Grid
Stocks
AI
XAUUSD
NAS100
USDJPY
트레이딩 봇, 지표, 플러그인 등 cTrader Store에서 제공되는 상품은 제3자 개발자에 의해 제공되며, 이는 단순히 정보 및 기술적 접근을 목적으로 제공된 것입니다. cTrader Store는 중개인이 아니며, 투자 조언, 개인별 추천 또는 향후 성과에 대한 어떠한 보장도 제공하지 않습니다.
이 작성자의 상품 더 보기


좋아하실 만한 다른 항목


가격
가입일 14/01/2025
55
판매
11.5K
무료 설치