
Descripción
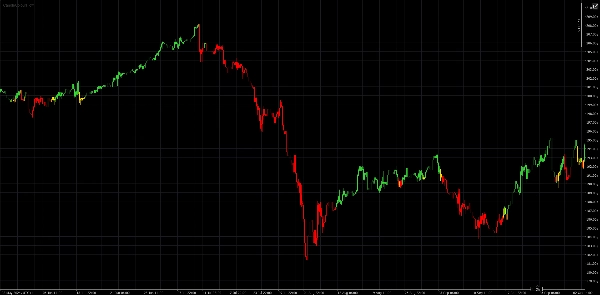
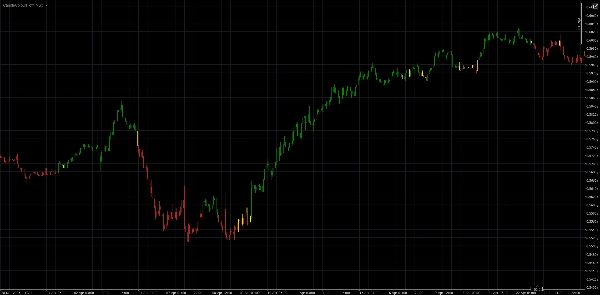
CandleColourFlow es un indicador innovador diseñado para identificar clara y rápidamente las tendencias y los puntos de inflexión del mercado en el mercado Forex. Con su sistema de colores simple e intuitivo, incluso los traders principiantes pueden tomar decisiones de trading más informadas.
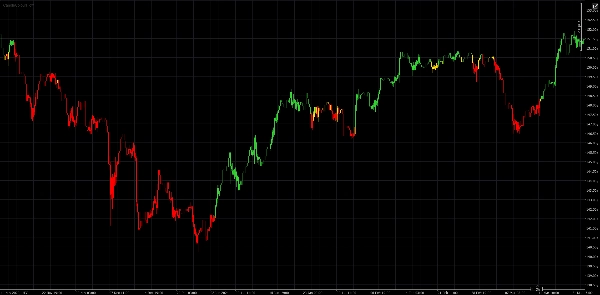
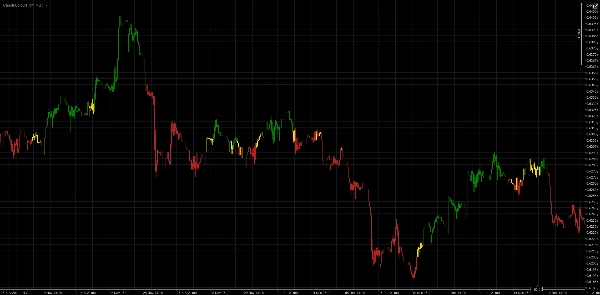
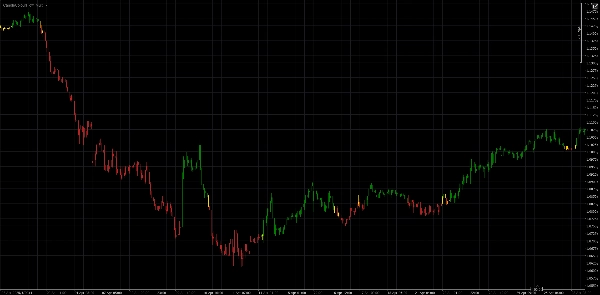
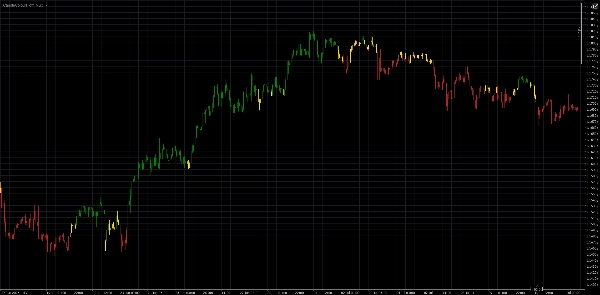
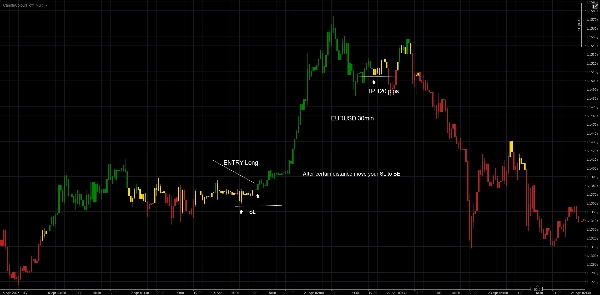
🔹 Velas verdes – sugieren una condición favorable para abrir posiciones largas
🔹 Velas rojas – sugieren una posible oportunidad de operación corta
🔹 Velas doradas – señalan indecisión en el mercado: posible consolidación o continuación de la tendencia
💡 ¿Qué hace único a CandleColourFlow?
- Perspectiva visual clara de las condiciones del mercado sin necesidad de múltiples indicadores
- Detección automática de cambios en el impulso y en la estructura de precios
- Perfecto para evaluar rápidamente el estado general del mercado
- Funciona en todos los marcos temporales, aunque en mi opinión 1h o más es mejor, pero todo depende de las preferencias
⚠️ Aviso legal:
Este indicador está destinado únicamente a fines educativos. No constituye asesoramiento de inversión ni una recomendación para ejecutar ninguna transacción financiera.
¿Buscas más?
Próximamente llegarán versiones adicionales de CandleColourFlow, cada una con características únicas y un soporte de mercado más amplio.
Resumen
Valoraciones de clientes
5 | 0 % | |
4 | 100 % | |
3 | 0 % | |
2 | 0 % | |
1 | 0 % |


![Logotipo de "[Hamster-Coder] Pivot Points MTF"](https://cdn.ctrader.com/image/webp/4c143e5a-309c-40e3-a578-f04d1e133ffa_31159)


