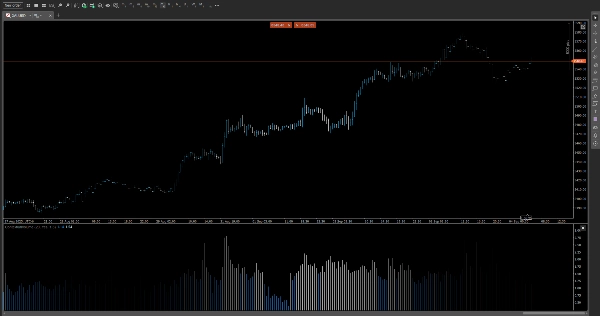
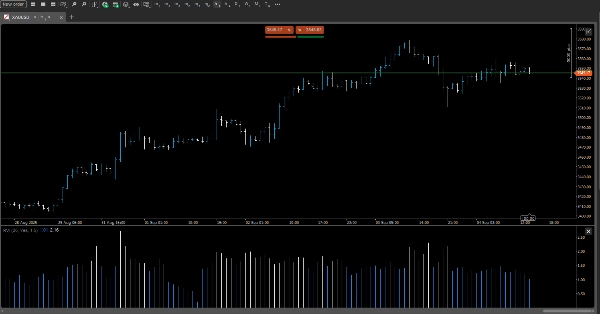
Brókeres y props
Para empresas
00
Days
:
00
Hours
:
00
Minutes
:
00
Seconds
RVI
Indicador
1 compras
Version 1.0, Sep 2025
Windows, Mac
Desde 08/08/2025
Ventas
12
Instalaciones gratis
1428
Imagen cargada de "RVI"Imagen cargada de "RVI"

📊 Relative Volume Intraday (RVI)

Spot the volume surges that matter—when they matter.

RVI is a precision-crafted indicator that compares current volume to its historical average for the same time of day, revealing hidden momentum and liquidity shifts across intraday sessions.


🔍 Key Features

Time-of-Day Volume Profiling

Calculates average volume per time slot (e.g., 10:15 AM) across previous sessions, giving you a contextual benchmark for every candle.

Multi-Timeframe Support

Works seamlessly from 5-minute charts up to 12-hour timeframes, adapting to your trading style—scalping, swing, or session-based.

Dynamic Color Coding

Highlights candles with above-average volume using customizable color thresholds. Instantly spot high activity zones with intuitive visual cues.

Ratio vs. Difference Mode

Choose your preferred metric:

Ratio Mode: Displays current volume ÷ average volume (e.g., 2.3×)

Difference Mode: Shows absolute deviation (e.g., +1,200 contracts)

Overlay or Panel Display

Toggle between inline chart overlays or a compact side panel for clean integration with your existing layout.


🎯 Use Cases

Confirm breakout strength with volume spikes relative to typical activity

Filter false signals during low-volume periods

Identify institutional footprints during key intraday windows

Enhance volume-based strategies with time-aware context


⚙️ Customization Options

Adjustable lookback period for historical averaging

User-defined color thresholds for volume intensity

Toggle display mode (Ratio/Difference)

Compatible with dark/light themes

0.0
Valoraciones: 0
Valoraciones de clientes
Este producto todavía no se ha valorado. ¿Ya lo ha probado? Sea el primero en informar a otros.
Indices
Prop
Breakout
Commodities
Forex
Crypto

Más de este autor

FVG
The Indicator is a powerful tool for price-action traders seeking to identify and exploit short-term imbalances.
Indicador
Indices
XAUUSD
Breakout
+3
AnchoredVWAP
A precision overlay tool that combines session-aware VWAP logic and standard deviations.
Indicador
Grid
NAS100
XAUUSD
+6
AutoFibRetracement
A powerful overlay tool designed to automatically plot Fibonacci retracement levels based on a custom window.
Indicador
Indices
Prop
Stocks
+3
Smooth Heiken Ashi
The Smooth Heiken Ashi indicator is a refined charting tool designed to filter out market noise and highlight true price
Indicador
NAS100
Indices
XAUUSD
+7
T3 Moving Average
A next‑generation moving average designed to deliver exceptional smoothness with minimal lag.
Indicador
Indices
Prop
Stocks
+3
Fractals
Fractals is a precision-engineered trading indicator for cTrader that reveals the hidden architecture of price action.
Indicador
NAS100
Indices
XAUUSD
+4
PrevDayProjection
Automatically calculates the previous day’s high and low, determines the range, and then projects Fibonacci levels.
Indicador
NAS100
Indices
XAUUSD
+7
InstitutionalSignalOscillator
A precision-engineered indicator designed for traders who demand signal integrity across volatile markets.
Indicador
Indices
Breakout
Prop
+6
pATR
An indicator that redefines ATR by applying a percentile-based filter giving traders a grounded view of volatility.
cBot
NAS100
Indices
XAUUSD
+4
VolatilityScalper
A trading robot designed for traders who want precision for high-volatility markets (XAUUSD, US500, US100, WTI, others.)
Indicador
Breakout
AI
Scalping
KaufmanEfficiencyRatio
A precision tool for measuring how efficiently price moves from point A to B.
Indicador
NAS100
Indices
XAUUSD
+6
OR Session Zones
A high‑precision Opening Range indicator that detects session opens (NY, London, EU, Tokyo, Shanghai)

Puede interesarle

Indicador
RSI
Breakout
XAUUSD
+12
Stop Loss Professional
Stop Loss Pro – Precision Risk Management for Every Trader
Indicador
RSI
Commodities
Signal
+1
Dot Momentum %BB Indicator
Dynamic circles visualize price's volatility position. Like RSI for market overextension & stretch. Quantify context.
Indicador
Indices
Breakout
Prop
+7
Swing Anchored Vwap - Pro ( + Alerts )
VWAP anchored to swings with real-time alerts. Your pro edge for precise entries/exits.
Market Sessions V2_NSC
Market Session V2: Full Control. colors, history, session/text toggles, font size. Elevate your strategy!
Mejor valorado
Gratis
EKVWAP
This is an advanced VWAP indicator (Anchored or non-Anchored) that allows you to customize all the aspects of it.
Indicador
Breakout
Institutional Flow Radar
Institutional Flow Radar scans the chart for abnormal volume events and classifies them into two groups: Capital &Public
ZigZagSmartAlert_demo
ZigZag Smart Alert DEMO for cTrader DEMO VERSION 24 hours free trial! This is a DEMO version of the ZigZag Smart Aler
Candles_Painter
Overlay HTF context on any chart: color bars by HTF and draw filled HTF bodies with optional High/Low lines.
Indicador
Forex
EURUSD
USDJPY
4 Currencies_NSC
Relative Currency Strength: AUD,USD,EUR,JPY. See which is stronger! Better pair picks. Better Trades!
Indicador
NAS100
NZDUSD
XAUUSD
+12
Fair Value Gap Pro
Institutional FVG detection with HTF projection, precise volume deltas, and smart fill logic.
Indicador
Indices
Commodities
Stocks
+2
XY Bar Info Panel v1.5
Overlay panel showing bar date/time, OHLC, tick Volume, percent change, and market session - fully customizable.
Indicador
Indices
Breakout
Prop
+6
pATR
An indicator that redefines ATR by applying a percentile-based filter giving traders a grounded view of volatility.