
Series - FXMaster
Indicador
3 compras
Versión 1.0, Jul 2025
Windows, Mac
4.6
Valoraciones: 3

Descripción
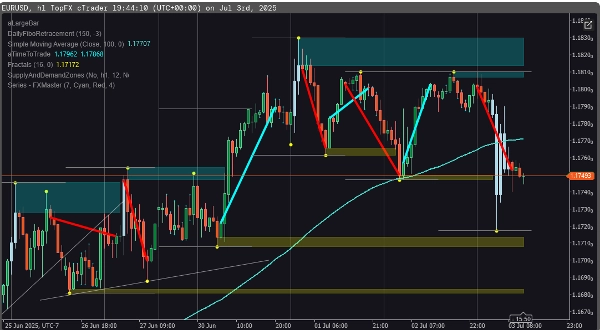
Descubra tendencias de alta probabilidad con precisión. El indicador Multi-Symbol Trendlines detecta series de Máximos Más Altos / Mínimos Más Altos / Cierres Altos o Mínimos Más Bajos / Máximos Más Bajos / Cierres Bajos, ofreciéndole una visión clara y personalizable de las tendencias alcistas y bajistas, en cualquier símbolo del mercado.
🚀 Características clave
- Detección de Secuencias de Tendencia: Identifique secuencias alcistas o bajistas basadas en patrones consecutivos de estructura de precios.
- Umbrales Personalizables: Configure cuántas barras se necesitan para confirmar una tendencia válida; ajústelo para que coincida con su estrategia.
- Líneas de Tendencia Visuales: Dibuja automáticamente líneas de tendencia directamente en su gráfico, codificadas por colores para tendencias alcistas y bajistas.
🎯 Para quién es
- Operadores de Acción del Precio que confían en la estructura y el ritmo más que en los indicadores.
- Seguidores de Tendencias que buscan confirmación temprana de la estructura.
- Observadores Multi-Símbolo que necesitan una herramienta para dominarlos a todos.
Resumen
Resumen de IA
The Series - FXMaster indicator identifies high-probability trends by detecting sequences of price action patterns such as Higher Highs, Higher Lows, High Closes, Lower Lows, Lower Highs, and Low Closes. It provides clear, customizable insights into uptrends and downtrends across any market symbol, including Forex, indices, commodities, cryptocurrencies, and stocks. Key features include trend sequence detection to spot bullish or bearish patterns based on consecutive price structures, customizable thresholds allowing users to set the number of bars required to confirm a trend, and automatic drawing of color-coded trendlines directly on charts for visual clarity. This tool is designed for price action traders who prioritize market structure and rhythm, trend followers seeking early confirmation of trends, and multi-symbol watchers who require a unified indicator for multiple markets.
Perfil del indicador
Valoraciones de clientes
4.6
Valoraciones: 3
5 | 67 % | |
4 | 33 % | |
3 | 0 % | |
2 | 0 % | |
1 | 0 % |
Valoraciones de clientes
July 14, 2025
The opening read should not drive the whole decision, but it is just a support layer.
July 8, 2025
The journal has a cleaner path, but it works better with a written plan.
Conversación
Preguntas frecuentes
Forex
Indices
Commodities
Crypto
Stocks
Los productos disponibles a través de cTrader Store, incluidos bots, indicadores y plugins para operar, son proporcionados por desarrolladores de terceros y están disponibles únicamente con fines informativos y de acceso técnico. cTrader Store no es un bróker, por lo que no proporciona asesoramiento de inversión, recomendaciones personales ni ninguna garantía de rentabilidad futura.


Precio
Desde 11/01/2025
19
Ventas