
Descripción
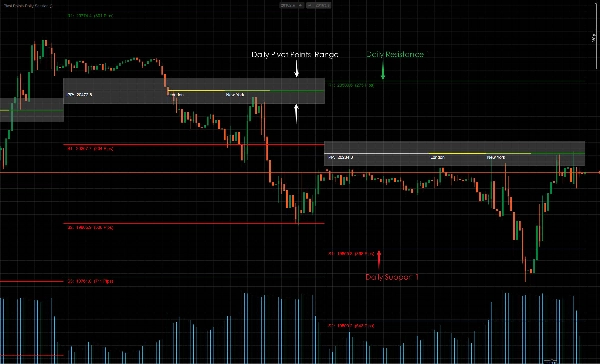
Aquí está la fórmula para calcular los Puntos Pivote estándar:
PP = (Alto + Bajo + Cierre)/3
S1 = (PP * 2) – Alto
S2 = PP – (Alto – Bajo)
S3 = Bajo – 2(Alto – PP)
R1 = (PP * 2) – Bajo
R2 = PP + (Alto – Bajo)
R3 = Alto + 2(PP – Bajo)
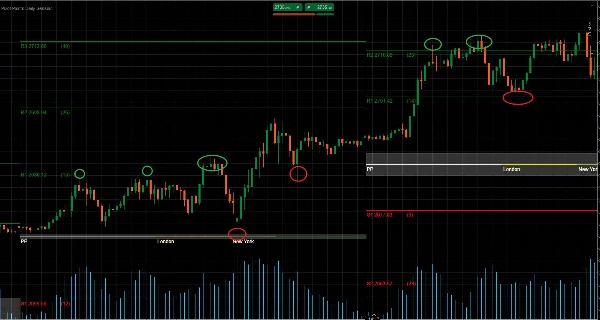
Los puntos pivote pueden usarse para identificar la tendencia general, ya que un movimiento a través de los puntos pivote hacia arriba indica una tendencia alcista. Mientras tanto, lo contrario, cuando el precio continúa cayendo por debajo de los puntos pivote durante una sesión, indica una tendencia bajista.
En un mercado lateral, los traders pueden simplemente vender (ir en corto) en la resistencia y comprar (ir en largo) en el soporte. Por ejemplo, si el mercado se encuentra entre R1 y S1, las órdenes de compra se colocarán alrededor de S1, y las órdenes de venta alrededor de R1.
En un mercado con tendencia, los Puntos Pivote relevantes actuarán como puntos de referencia para que los mercados en retroceso retomen la tendencia principal. Por ejemplo, si los precios están por encima de PP durante una tendencia alcista pero por debajo de R2, los traders pueden buscar colocar órdenes de compra lucrativas alrededor de R1.
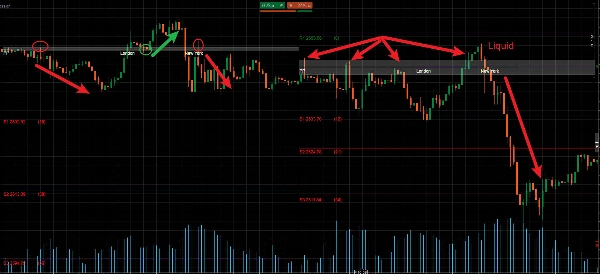
Los niveles de soporte y resistencia están destinados a ser rotos en algún momento en el mercado. Estos períodos de ruptura pueden ofrecer muchas oportunidades de trading. Los puntos pivote también pueden usarse para operar posibles rupturas de precio en el mercado.
Las rupturas de precio ocurren cuando el precio supera un nivel existente de soporte o resistencia y efectivamente cambia su función. Por ejemplo, si ocurre una ruptura a la baja en S2, la línea pivote dejará de ser una línea de soporte y ahora se considerará una línea de resistencia.
En este escenario, solo se considerarán órdenes de venta por debajo de S2, y otras líneas pivote pueden guiar la colocación de stop loss y toma de ganancias. Los stop loss para órdenes de venta pueden colocarse por encima de S2 y S1, con objetivos de ganancia en S3 y por debajo.
中文说明:
枢轴点可用于识别整体趋势,因为价格向上突破枢轴点表明上升趋势。与此同时,相反的情况,即价格在交易时段内持续跌破枢轴点,则表明下降趋势。
在区间震荡市场中,交易者可以简单地在阻力位做空(卖出)和在支撑位做多(买入)。例如,如果市场在R1和S1之间波动,买单将放置在S1附近,卖单放置在R1附近。
在趋势市场中,相关的枢轴点将作为回调市场恢复主要趋势的参考点。例如,如果在上升趋势中价格高于PP但低于R2,交易者可以考虑在R1附近设置有利可图的买单。
支撑位和阻力位在某些市场情况下必然会被突破。这些突破期可以在市场中提供许多交易机会。枢轴点也可用于交易市场中潜在的价格突破。
价格突破发生在价格冲破现有的支撑位或阻力位并有效转换其角色时。例如,如果在S2处发生向下突破,该枢轴线将不再是支撑线,而将被视为阻力线。
在这种情况下,只有在S2下方才会考虑卖单,其他枢轴线可以指导止损和止盈的设置。卖单的止损可以设在S2和S1上方,盈利目标设在S3及以下。
Resumen
Valoraciones de clientes
5 | 100 % | |
4 | 0 % | |
3 | 0 % | |
2 | 0 % | |
1 | 0 % |


