
Описание
🚀 Более 10 000 трейдеров уже используют наши ТОП индикаторы🏆
Узнайте, почему профессионалы выбирают нас – самые мощные инструменты на cTrader (индикаторы, алгоритмы и cBots) ждут вас.
👉 Получите все наши ТОП системы здесь:
_______________________________________________
_______________________________________________
📌 Индикаторы структуры рынка
· ✅ AdvancedMarket Structure: Bos, Choch, SwinLevels, Order Blocks, Market Structure& Liquidity Finder
· 🔄 Dynamic Market StructureAnalysis of Turning Points
· 🧱 Order Block
· ⚖️ Market Imbalance
· ⛓️ BOS & CHOCH
· 🧠 ICT Power of 3
______________________________________________________________-
Магазин cBots : 🧠 Gold & BTC BreakoutSession Pivots 🧠
_______________________________________________
🔚 Системы умного выхода
_______________________________________________
📐 Индикаторы ZigZag
· 🔍 ZigZag Price LiquidityProjection
· ➖ ZigZag
_______________________________________________
🧱 Индикаторы поддержки и сопротивления
· 🟩 SmartTrend Support &Resistance Lines
· 🧱 All Support and ResistanceLevels
_______________________________________________
📊 Индикаторы тренда и каналов
· 📊 Supertrend
_______________________________________________
💧 Инструменты объема и ликвидности
_______________________________________________
⚡ Индикаторы импульса и RSI
· 🔎 Multi-Level Candle BiasTracker
_______________________________________________
🔮 Инструменты прогнозирования и проекции
· 📐 Prediction Based on Linreg& ATR
· 📏 Fibonacci Linear RegressionMulti-timeframe
· 📈 Volume-Powered Market Flow Projector
_________________________________________________________________________________
_________________________________________________________________________________
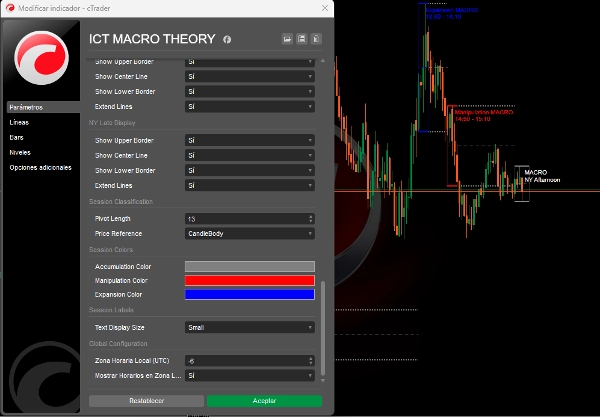
🌐 ICT MACRO THEORY
⚠️ ВАЖНОЕ ЗАМЕЧАНИЕ: Этот индикатор работает только на таймфреймах ниже 5 минут.
Объяснение ICT Macro Periods
ICT макропериоды — это по сути короткие интервалы, в течение которых алгоритм ищет ликвидность или корректирует цену для зазоров справедливой стоимости. Основой этих ICT макросов является теория времени и цены ICT.
Макро — это "короткая серия инструкций, создающая событие в доставке цены", как определено самим ICT.
ICT макросы не являются полноценными торговыми стратегиями, но могут добавить конвергенцию к вашим сделкам и максимизировать прибыль. Они происходят во время сессий Лондона, Нью-Йорка, полудня и послеобеденной сессии.
🔮 Продвинутая реализация теории ICT Macro Times:
Прямое соединение с концепциями ICT:
Код реализует именно 3 типа ICT макросов, описанных в теории, используя логику классификации на основе:
- Анализа структуры рынка:
-
- Обнаружение макросессий
- Записывает точное время ICT (Лондон 02:33, Нью-Йорк 09:50 и т.д.).
- Обнаруживает структурные изменения до и во время каждой макросессии.
- Автоматически классифицирует на:
-
- 🟥 Манипуляция: Когда цена смахивает ликвидность с обеих сторон (покупка/продажа).
- 🟦 Расширение: Направленные движения, забирающие ликвидность с одной стороны (в соответствии с трендом).
- 🟩 Аккумуляция: Узкий диапазон, где цена "накапливает" ликвидность.
- Расширенные ключевые уровни:
-
- Отрисовывает максимумы/минимумы каждой макросессии.
- Вычисляет и продлевает среднюю цену (среднюю точку) до следующей сессии.
- Эти уровни служат динамической поддержкой/сопротивлением (важно в ICT!).
- Обнаружение ликвидности в реальном времени:
-
- Использует данные с интервалом 1 минута для определения точных пивотов (как на более низких таймфреймах).
Предстоящие улучшения и обновления:
- Обнаружение ликвидных смахиваний: Будет выявлять предыдущие смахивания ликвидности (максимумы/минимумы предыдущего дня/недели).
- Зазоры справедливой стоимости (FVG): Будет обнаруживать и визуализировать зазоры справедливой стоимости.
📊 Практический пример ICT
Сценарий открытия Нью-Йорка (09:50-10:10):
- До сессии: Цена смахивает ликвидность с покупательской стороны (локальный минимум).
- Во время сессии:
-
- Классифицировано как 🟥 МАНИПУЛЯЦИЯ.
- Цена переходит в медвежью структуру.
- После сессии:
-
- Продленные линии отмечают сопротивление на максимумах сессии.
- Отказ от сделки в зоне с RR 1:3.
✅ Верность принципу ICT:
"Макросы не являются полноценными стратегиями, но добавляют конвергенцию, определяя, где алгоритмы будут искать ликвидность."
Сводка
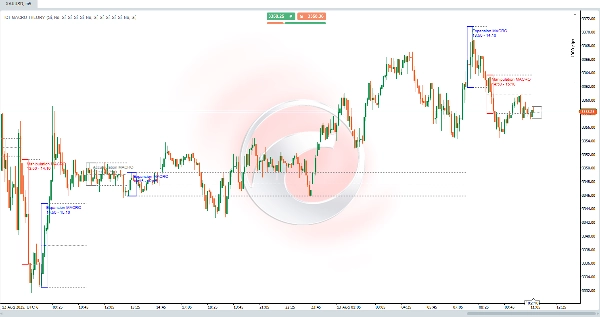
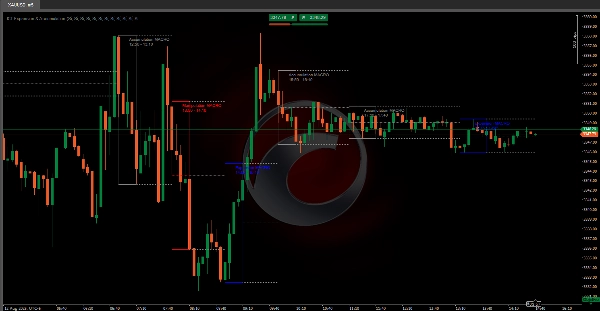
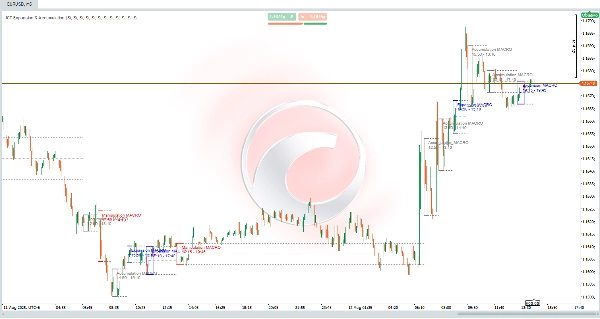
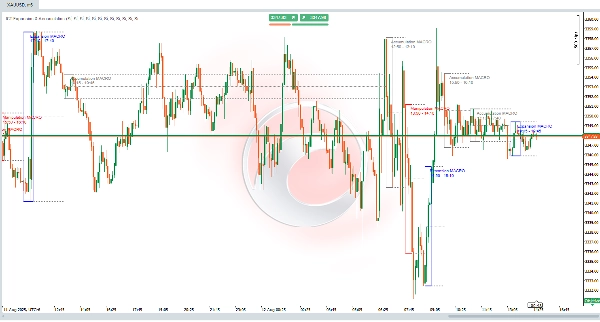
The indicator analyzes market structure and detects key macro sessions—London, New York, midday, and afternoon—recording exact ICT times. It classifies price behavior into three types of macros: Manipulation (price sweeps liquidity on both sides), Expansion (directional movement aligned with trend), and Accumulation (tight range where price accumulates liquidity). It also draws and extends session highs, lows, and average price levels to act as dynamic support and resistance.
Using 1-minute data, ICT MACRO THEORY detects precise pivots for real-time liquidity identification. While not a complete trading strategy, it adds confluence to trades by highlighting where algorithms seek liquidity. Planned updates include detection of liquidity sweeps and visualization of fair value gaps.
This tool is intended for traders seeking to incorporate ICT macro time concepts into their analysis for enhanced market structure insight and liquidity detection on very short timeframes.


![Логотип продукта "[Stellar Strategies] BOS Trend 1.0"](https://cdn.ctrader.com/image/webp/6cdec0f1-0e97-4a82-a8a4-2b67aed54d38_25695)

