![Trading product for [Stellar Strategies] BOS Trend 1.0 Индикатор, image 1](https://cdn.ctrader.com/image/webp/6cdec0f1-0e97-4a82-a8a4-2b67aed54d38_25695)
[Stellar Strategies] BOS Trend 1.0
Индикатор
455 скачивания
Версия 1.0, Nov 2024
Windows, Mac
5.0
Отзывы: 1
![Trading product for [Stellar Strategies] BOS Trend 1.0 Индикатор, image 2](https://cdn.ctrader.com/image/webp/2738d263-76dc-4e6f-a818-7e66349e6883_25696)
![Trading product for [Stellar Strategies] BOS Trend 1.0 Индикатор, image 3](https://cdn.ctrader.com/image/webp/5338cc95-bf3e-4db4-b575-3e935cff8e90_25697)
![Trading product for [Stellar Strategies] BOS Trend 1.0 Индикатор, image 4](https://cdn.ctrader.com/image/webp/59502053-3cfb-4232-b1da-c27ad8852e60_25698)
![Trading product for [Stellar Strategies] BOS Trend 1.0 Индикатор, image 5](https://cdn.ctrader.com/image/webp/e32ea74f-662d-4c30-8571-3b8062b6be90_25699)
![Trading product for [Stellar Strategies] BOS Trend 1.0 Индикатор, image 6](https://cdn.ctrader.com/image/webp/fe0c3dd9-19fe-4833-bd0e-640ccec47e31_25700)
![Trading product for [Stellar Strategies] BOS Trend 1.0 Индикатор, image 7](https://cdn.ctrader.com/image/webp/0fa38032-d41c-4684-a0ec-c9512db0d567_25701)
![Trading product for [Stellar Strategies] BOS Trend 1.0 Индикатор, image 8](https://cdn.ctrader.com/image/webp/10e865d7-9813-4932-ac9b-3b76516518c9_25702)
Описание
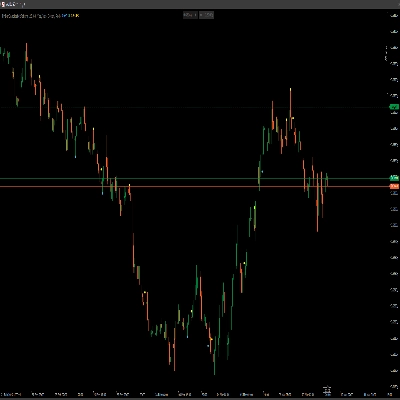
Премиум-индикатор [Stellar Strategies] BOS Trend — это многофреймовый индикатор Break of Structure (BOS), разработанный для cAlgo. Он предоставляет трейдерам важную информацию о рыночных трендах, обнаруживая восходящие и нисходящие BOS на разных таймфреймах.
Особенности:
- Анализ на нескольких таймфреймах: Анализирует движения цены на различных таймфреймах (от 1 минуты до дневного).
- Настраиваемые таймфреймы: Включайте или отключайте конкретные таймфреймы для настройки анализа.
- Оповещения в реальном времени: Отображает сообщения на графике при обнаружении BOS.
- Удобный интерфейс: Настраиваемый цвет текста для лучшей видимости на разных фонах графика.
Параметры:
- Период обратного просмотра (по умолчанию: 20): Количество баров для обратного просмотра при обнаружении BOS.
- Параметры таймфрейма:
-
Использовать таймфрейм 1 минутаИспользовать таймфрейм 5 минутИспользовать таймфрейм 15 минутИспользовать таймфрейм 30 минутИспользовать таймфрейм 1 часИспользовать таймфрейм 4 часаИспользовать дневной таймфрейм
- Цвет текста (по умолчанию: "Жёлтый"): Устанавливает цвет сообщений BOS.
Как использовать индикатор:
- Добавление индикатора:
-
- Откройте платформу cAlgo.
- Перейдите в раздел индикаторов и добавьте [Stellar Strategies] BOS Trend на ваш график.
- Настройка параметров:
-
- Период обратного просмотра: Настройте период обратного просмотра в соответствии с вашей торговой стратегией (по умолчанию 20 баров).
- Включение/отключение таймфреймов: Выберите таймфреймы для анализа, отмечая или снимая соответствующие опции.
- Цвет текста: Выберите цвет текста, который хорошо контрастирует с фоном вашего графика для лучшей видимости.
- Чтение сигналов BOS:
-
- Восходящий BOS: Зелёные линии указывают на восходящий пробой структуры.
- Нисходящий BOS: Красные линии указывают на нисходящий пробой структуры.
- Сообщения BOS: Сообщения типа "Текущий TF: обнаружен восходящий BOS" будут отображаться на графике вместе с другими сообщениями с разных включённых таймфреймов.
- Интерпретация данных:
-
- Используйте сигналы BOS для определения возможных разворотов или продолжений тренда.
- Обращайте внимание на анализ нескольких таймфреймов для более надёжного подтверждения трендов.
- Настройка отображения:
-
- Вы можете настроить цвет текста и позицию сообщений BOS для лучшей читаемости.
Пример:
Вот пошаговый пример использования индикатора [Stellar Strategies] BOS Trend:
- Добавьте индикатор:
-
- Откройте график в вашей платформе cAlgo.
- Перейдите в
Indicatorsи выберите [Stellar Strategies] BOS Trend.
- Настройте параметры:
-
- Установите
Период обратного просмотрав 20. - Включите
Использовать таймфрейм 1 минута,Использовать таймфрейм 5 минути другие таймфреймы по необходимости. - Установите
Цвет текстав "Жёлтый" для лучшей видимости.
- Установите
- Следите за графиком:
-
- Наблюдайте за зелёными (восходящий тренд) и красными (нисходящий тренд) линиями BOS на графике.
- Ищите сообщения, указывающие на обнаружение BOS на разных таймфреймах.
- Принимайте решения:
-
- Используйте сигналы BOS для принятия обоснованных торговых решений на основе разворотов или продолжений тренда.
Следуя этим шагам, вы сможете эффективно использовать индикатор [Stellar Strategies] BOS Trend для улучшения вашей торговой стратегии с помощью анализа BOS на нескольких таймфреймах.
Если вам нужна дополнительная помощь или информация, пожалуйста, дайте знать! 📈📉
Сводка
ИИ-сводка
The [Stellar Strategies] BOS Trend is a multi-timeframe Break of Structure (BOS) indicator designed for the cAlgo platform. It identifies key market trend shifts by detecting uptrend and downtrend BOS signals across multiple timeframes ranging from 1 minute to daily charts. Users can customize which timeframes to analyze and adjust the lookback period for BOS detection, with a default of 20 bars. The indicator provides real-time alerts directly on the chart, displaying messages such as "Current TF: Uptrend BOS detected" to inform traders of structural breaks. Visual cues include green lines for uptrend BOS and red lines for downtrend BOS. The interface allows customization of text color to enhance visibility against different chart backgrounds. Traders can use the BOS signals to identify potential trend reversals or continuations, leveraging multi-timeframe analysis for stronger confirmation. The indicator supports flexible configuration to fit various trading strategies and preferences.
Профиль индикатора
Отзывы покупателей
5.0
Отзывы: 1
5 | 100 % | |
4 | 0 % | |
3 | 0 % | |
2 | 0 % | |
1 | 0 % |
Отзывы покупателей
August 18, 2025
Pros: Automatically detects and marks Break Of Structure points indicating trend shifts. Clean visual arrows and straightforward setup. Cons: No alerts, tooltips, or template saving. May produce noise without volume or market context filters.
Обсуждение
Частые вопросы
Продукты, доступные в cTrader Store, включая торговых ботов, индикаторы и плагины, предоставляются сторонними разработчиками и доступны исключительно в информационных и технических целях. cTrader Store не является брокером и не предоставляет инвестиционные консультации, персональные рекомендации или какие-либо гарантии будущей доходности.
Больше от этого автора
![Логотип продукта "[Stellar Strategies] Market Structure Breakout"](https://cdn.ctrader.com/image/webp/bceec265-3247-4b11-915f-6295a29c106d_28465)
![Логотип продукта "[Stellar Strategies] Market Session Ultimate"](https://cdn.ctrader.com/image/webp/61ffd537-0125-4246-9e72-42eca1791d64_28232)
![Логотип продукта "[Stellar Strategies] Wave Trend Pro"](https://cdn.ctrader.com/image/webp/5f226fbb-245a-41cd-9cdd-b018257d5e6d_28617)
![Логотип продукта "[Stellar Strategies] Inside Bar with Signals"](https://cdn.ctrader.com/image/webp/1d9e8bfa-3b2c-4440-bb37-5856902008a7_30683)
![Логотип продукта "[Stellar Strategies] Linear Regression Candles 1.1"](https://cdn.ctrader.com/image/webp/8b9cff9f-2431-46d2-b0ec-c7f55f4a4a6d_27918)
![Логотип продукта "[Stellar Strategies] Smart ADX"](https://cdn.ctrader.com/image/webp/af13b084-b6f6-41db-b7bc-c7e688b57b05_36929)
![Логотип продукта "[StellarStrategies] Scheduled Trade Executor"](https://cdn.ctrader.com/image/webp/daefc6af-7eca-453e-878d-1b981be2c401_25646)
![Логотип продукта "[Stellar Strategies] VBO"](https://cdn.ctrader.com/image/webp/f034c012-94d4-445a-a01b-febd1cdedaef_36944)
![Логотип продукта "[Stellar Strategies] SP500 Gap Closure cBot 1.0"](https://cdn.ctrader.com/image/webp/92c23fdc-4ad1-4e61-bdb5-c77f6ec8c539_27686)
![Логотип продукта "[Stellar Strategies] Candlestick Patterns Dashboard"](https://cdn.ctrader.com/image/webp/ae8691a5-4884-4553-9bcc-64e16ac82a30_38344)
![Логотип продукта "[Stellar Strategies] QQE"](https://cdn.ctrader.com/image/webp/e702104a-874c-4b39-97dd-fb34518d1015_27712)
![Логотип продукта "[Stellar Strategies] Visual Trend Momentum"](https://cdn.ctrader.com/image/webp/48aee0a5-f10e-4bc8-9671-78e156fcc5df_27548)


![Логотип продукта "[Hamster-Coder] Moving Average"](https://cdn.ctrader.com/image/webp/1bd952ad-57d2-4db2-9b49-b01be0b048b8_30113)


Цена
20.46M
Торгуемый объем
8K
Выигранные пипы
25
Продажи
4.34K
Бесплатные установки