
说明
🚀 超过10,000名交易者已经使用我们的顶级 指标🏆
👉 在这里获取我们所有的顶级系统:
_______________________________________________
📌 市场结构指标
· ✅ AdvancedMarket Structure: Bos, Choch, SwinLevels, Order Blocks, Market Structure& Liquidity Finder
· 🔄 动态市场结构转折点分析
· 🧱 订单区块
· ⚖️ 市场失衡
· ⛓️ BOS & CHOCH
· 🧠 ICT 三力
· 🌀 市场极性区域
_______________________________________________
🔚 智能退出系统
· 📍 跟踪智能算法
_______________________________________________
📐 之字形指标
· 🔍 之字形价格流动性投影
· 🧭 支撑与阻力结构之字形
· ➖ 之字形
· 🎯 之字形极端追踪器
_______________________________________________
🧱 支撑与阻力指标
· 🟩 智能趋势支撑与阻力线
· 🧱 所有支撑与阻力水平
_______________________________________________
📊 趋势与通道指标
· 🔄 自动趋势通道
· 📊 超级趋势
· ⚡动量趋势分析器
· 🧠 自适应趋势通道
· 💥 通道突破系统
· 🌈 动态趋势梯度
· ⭐ 高级SSL通道
· 🔁 反应性移动平均线
_______________________________________________
💧 成交量与流动性工具
· 🔥 成交量POC热力图
· 📉 杠杆清算图
· 🔍 动量公平价值缺口
· 🕒 公平价值缺口时段
_______________________________________________
⚡ 动量与RSI指标
· 📈 RSI趋势触发器
· 🚀 动态区间动量
· 🔎 多级蜡烛偏向
追踪器
_______________________________________________
🔮 预测与投影工具
· 📐 基于线性回归与ATR的预测
· 📏 斐波那契线性回归多时间框架
· 📈 成交量驱动的市场流动投影器
自动供需: 💹
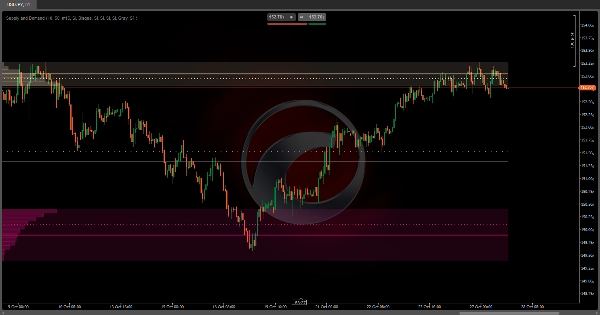
自动供需是一款高级成交量分析指标,能够自动识别图表上交易活动最集中的区域。📊 与其他静态指标不同,该指标会根据您观察的可视范围动态调整,每次缩放或滚动图表时都会重新计算这些区域。
它是如何工作的? ❓
算法将可见价格范围划分为多个水平区间(可配置,范围从2到500个分区),并分析每个区间的成交量。为了提高精度,它使用比您当前观察的时间框架更低的时间框架数据。🕒 例如,如果您查看的是1小时图,它可以分析15分钟蜡烛图,更详细地检测成交量的集中位置。
识别过程 🔍
指标从极端位置向中心工作:
- 从最高价开始: 🚀 它从可见范围的高点开始,逐级向下,累积每个价格区间的成交量。
- 从最低价开始: 📉 同时,它从低点向上累积成交量。
- 激活阈值: ⚡ 当任一区域累积的成交量达到总成交量的特定百分比(可配置,默认10%)时,该区域被标记为重要区域,搜索在该方向停止。
- 中间区域: ⚖️ 一旦识别出上下两个区域,中间空间被标记为中性或平衡区域。
它的用途是什么? 🎯
该指标是一种市场结构分析工具,帮助您:
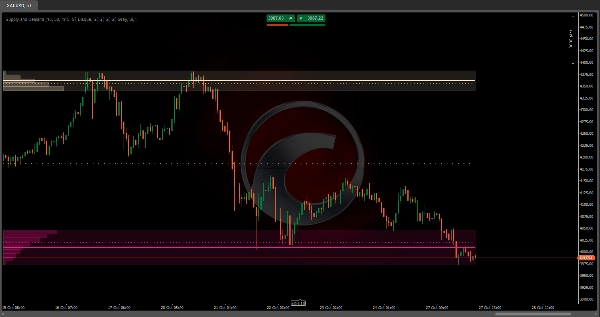
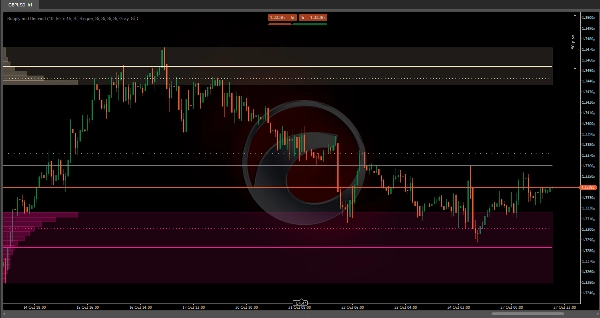
- 识别 供给区: 🏔️ 历史上卖出活动集中的上方区域。
- 识别 需求区: 🏖️ 买入活动集中的下方区域。
- 检测 平衡区: 🎭 买卖压力相互平衡的中间区间。
这些区域往往在未来对价格起到吸引作用,因为它们代表了许多参与者曾经建立仓位的水平。🧲
如何结合使用? 🔗
与价格行为策略:
- 等待对已识别区域的 回测,以寻找反转确认信号。
- 将这些区域用作 获利目标或 止损设置。
与趋势指标:
- 在 上升趋势中,当价格回测下方的 需求区时寻找入场机会。📈
- 在 下降趋势中,利用上方的 供给区作为卖出的阻力位。📉
与多时间框架分析:
- 在 更高时间框架识别区域,并在较低时间框架寻找确认信号。
- 来自更高时间框架的区域可能包含多个较低时间框架的区域。
与动量指标:
- 结合 RSI或随机指标,以确认区域内的超买/超卖状态。
- 供需区的背离可能预示潜在反转。
可自定义配置 ⚙️
该指标允许您独立完全调整每个区域:
- 激活/停用每个视觉元素(区域、平均线、加权线)。
- 成交量阈值: 必须累积的总成交量百分比,以将区域视为重要。
- 价格分割: 数值越高,精度越高,但计算量也越大。
- 较低时间框架: 定义成交量分析的粒度。
关键特性:自动适应 🔄
基于您的视图自动重新计算。 这意味着:
- 如果您 放大以查看某个时段的细节,它将识别该时段的具体供需区域。
- 如果您 缩小以查看数周或数月,它将重新计算整个期间的宏观区域。
- 每次您 滚动图表时,区域会更新以反映可见范围的上下文。
摘要
The indicator divides the visible price range into configurable horizontal levels (2 to 500 divisions) and analyzes volume traded at each level using data from a lower timeframe than the chart’s timeframe for enhanced accuracy. It identifies significant zones by accumulating volume from the highest and lowest visible prices until a configurable volume threshold (default 10%) is reached, marking these as supply and demand zones respectively. The area between these zones is designated as a balance zone, representing equilibrium between buying and selling pressures.
These zones highlight areas of historically high trading activity that often act as future price magnets. The indicator supports customization of visual elements, volume thresholds, price divisions, and analysis timeframe. It can be combined with price action strategies, trend indicators, multiple timeframe analysis, and momentum indicators like RSI or Stochastic to improve trade entries, exits, and confirmations.
Supported markets include Forex, Indices, Commodities, Stocks, and Cryptocurrencies, with symbols such as EURUSD, GBPUSD, BTCUSD, XAUUSD, and NAS100.
客户评价
5 | 50 % | |
4 | 0 % | |
3 | 0 % | |
2 | 0 % | |
1 | 50 % |


