present
가입하고 첫 구매 시 $50 할인을 받으세요
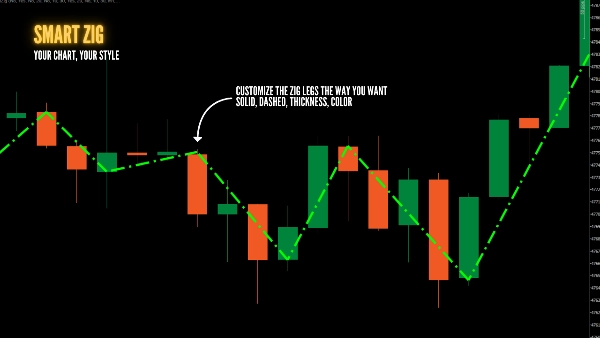
Trading product for SmartZig 지표 Key Levels BOS, image 1
SmartZig
지표
173 다운로드
버전 1.0, Apr 2026
Windows, Mac
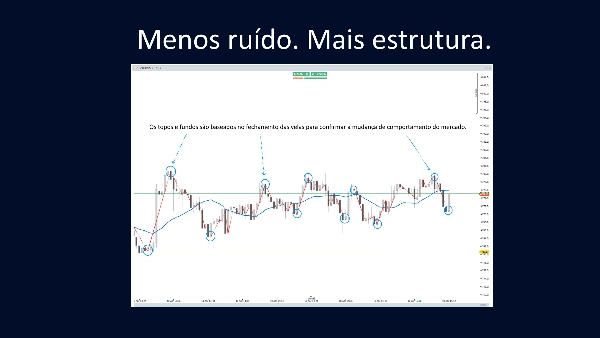
Trading product for SmartZig 지표 Key Levels BOS, image 2
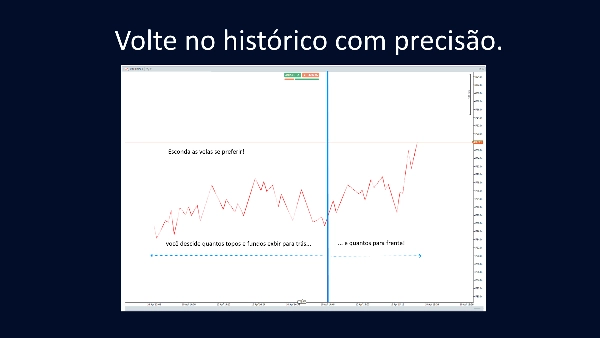
Trading product for SmartZig 지표 Key Levels BOS, image 3
Trading product for SmartZig 지표 Key Levels BOS, image 4
Trading product for SmartZig 지표 Key Levels BOS, image 5
Trading product for SmartZig 지표 Key Levels BOS, image 6
Trading product for SmartZig 지표 Key Levels BOS, image 7
Trading product for SmartZig 지표 Key Levels BOS, image 8
가입일 09/02/2026
28
판매
173
무료 설치

설명

📉 SMARTZIG — 궁극의 시장 구조 시각화 도구 (버전 🇧🇷 낮음)

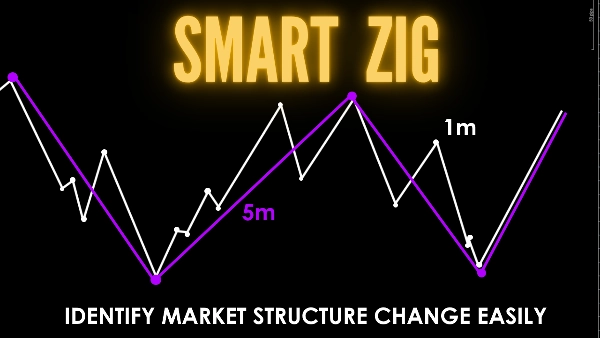
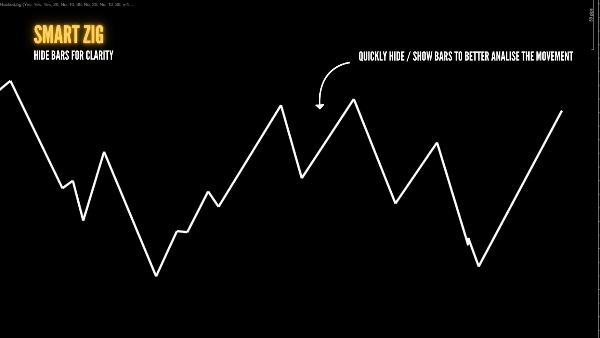
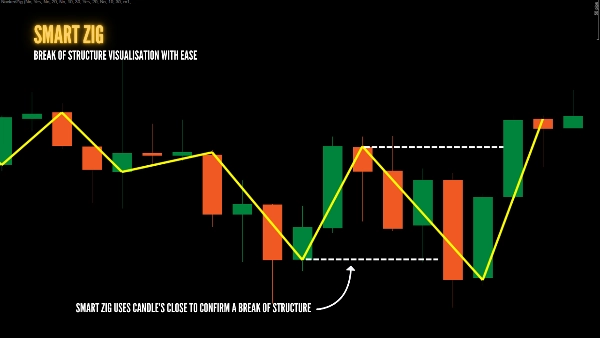
가격 움직임을 전문가처럼 읽으세요. SmartZig 는 캔들 몸통(시가와 종가)에서 직접 구조를 매핑하여 꼬리 노이즈를 제거합니다. 낮은 시간대(LTF)와 높은 시간대(HTF) 스윙을 동시에 오버레이하여 시장 구조 변화와 전달 상태 변화(CISD)를 더 쉽게 포착하고, 꼬리 대신 시가와 종가에 의존하여 확정된 가격 움직임과 유동성 스윕을 얻으세요. 기술 분석 시 차트 바를 숨겨 더 명확하게 확인할 수 있습니다.

✅ 왜 SMARTZIG로 업그레이드해야 하나요?

  • 듀얼 지그재그 엔진: 두 개의 독립적인 지그재그를 실행하여 빠른 추세와 느린 추세를 동시에 확인할 수 있습니다.
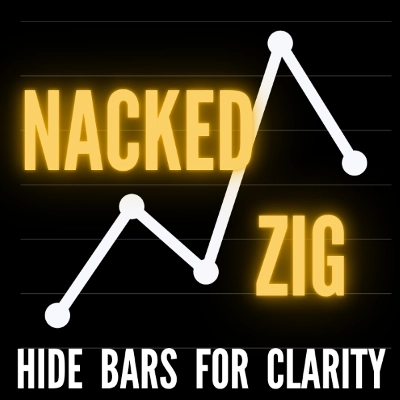
  • 네이키드 차트 모드: 한 번의 클릭으로 모든 캔들 바를 숨겨 지그재그 골격에만 집중할 수 있습니다.
  • 몸통 기반 정확도: 피벗은 시가/종가 수준에서 도출되어 가짜 꼬리 돌파를 방지합니다.
  • 인터랙티브 히스토리: 수직 앵커를 드래그하여 과거 세션의 구조적 구간을 즉시 확인할 수 있습니다.
  • 독립적인 타임프레임: 차트를 전환하지 않고 LTF와 HTF에 대해 서로 다른 소스 기간을 설정할 수 있습니다.
  • 깔끔한 실행: 수동으로 스윙을 그리는 것을 멈추고 지표가 실시간으로 스윙을 업데이트하도록 하세요.

📺 튜토리얼 시청 및 커뮤니티 참여:


(커뮤니티 성장을 돕기 위해 비디오 댓글에 질문이나 지원 요청을 게시해 주세요!)

🛠️ 주요 기능:

  • 사용자 정의 스타일: 각 지그재그에 대해 별도의 색상, 두께 및 선 스타일 설정 가능.
  • 구간 필터링: 보고 싶은 과거 구간 수를 정확히 선택할 수 있습니다.
  • 드래그 가능한 앵커: 마우스로 역사상의 어느 바든 연구 초점을 이동할 수 있습니다.
  • 전체 가시성 토글: 화면을 정리하기 위해 연구 전체를 즉시 숨기거나 표시할 수 있습니다.

🇧🇷 SMARTZIG — 궁극의 시장 구조 시각화 도구

가격 움직임(Price Action)을 전문가처럼 분석하세요. SmartZig 는 캔들 몸통(시가와 종가)에서 직접 구조를 매핑하여 꼬리 노이즈를 제거합니다. 낮은 시간대(LTF)와 높은 시간대(HTF) 스윙을 동시에 오버레이하여 시장 구조 변화와 전달 상태 변화(CISD)를 더 쉽게 포착하고, 꼬리 대신 시가와 종가에 의존하여 확정된 가격 움직임과 유동성 스윕을 얻으세요. 기술 분석 시 차트 바를 숨겨 더 명확하게 확인할 수 있습니다.

✅ 왜 SMARTZIG로 업그레이드해야 하나요?

  • 듀얼 지그재그: 두 개의 독립적인 지그재그를 실행하여 빠른 추세와 느린 추세를 동시에 확인할 수 있습니다.
  • 클린 차트 모드: 한 번의 클릭으로 모든 캔들을 숨기고 시장의 '골격'에만 집중하세요.
  • 몸통 기반 정확도: 시가/종가에서 도출된 피벗으로 가짜 꼬리 돌파를 방지합니다.
  • 인터랙티브 히스토리: 수직 앵커를 드래그하여 과거 세션의 구조적 구간을 즉시 확인할 수 있습니다.
  • 독립적인 타임프레임: 차트를 전환하지 않고 LTF와 HTF에 대해 서로 다른 소스 기간을 설정할 수 있습니다.
  • 빠른 실행: 수동으로 스윙을 그리는 것을 멈추고 지표가 실시간으로 구조를 업데이트하도록 하세요.

📺 튜토리얼 시청 및 질문하기:


(커뮤니티를 최대한 돕기 위해 위 비디오 댓글에 질문과 지원 요청을 게시해 주세요!)

🛠️ 기술적 하이라이트:

  • 사용자 정의 스타일: 각 지그재그에 대해 별도의 색상, 두께 및 선 스타일 설정 가능.
  • 구간 필터링: 보고 싶은 과거 구간 수를 정확히 선택할 수 있습니다.
  • 드래그 가능한 앵커: 마우스로 역사상의 어느 바든 연구 초점을 이동할 수 있습니다.
  • 전체 가시성 토글: 화면을 정리하기 위해 연구 전체를 즉시 숨기거나 표시할 수 있습니다.

요약

AI summary
SmartZig is a market structure visualization indicator designed for spot markets. It maps price action by analyzing candle bodies (open and close) rather than wicks, reducing noise and helping to avoid false breakouts. The indicator overlays lower timeframe (LTF) swings on higher timeframe (HTF) swings simultaneously, enabling clearer identification of market structure shifts and changes in state of delivery (CISD). Users can hide chart bars to focus solely on the ZigZag patterns.

Key features include a dual ZigZag engine that tracks fast and slow trends independently, customizable styling for colors and line thickness, and interactive history with draggable vertical anchors to explore past structural legs. It supports independent timeframe settings for LTF and HTF without switching charts and updates swings in real-time, eliminating the need for manual drawing. Additional functionalities include leg filtering to control the number of visible historical legs and a full visibility toggle to declutter the chart.

SmartZig is tagged for key levels, break of structure (BOS), liquidity sweeps and grabs, change of character (CHOCH), market structure, and support/resistance analysis. It provides a visual tool for technical analysts to read price action more accurately and confirm liquidity events based on open-close pivots. A tutorial video is available for user guidance.
지표 프로필
지표 카테고리
패턴
출력 유형
시각화
데이터 요구 사항
막대만

고객 리뷰

0.0
리뷰: 0
고객 리뷰
이 상품에 대한 리뷰가 아직 없습니다. 이미 사용해 보셨나요? 다른 사람들에게 가장 먼저 소개해 주세요!

상담

자주 묻는 질문(FAQ)
Key Levels
BOS
Liquidity Sweep
CHOCH
Market Structure
Liquidity Grab
Support & Resistance
트레이딩 봇, 지표, 플러그인 등 cTrader Store에서 제공되는 상품은 제3자 개발자에 의해 제공되며, 이는 단순히 정보 및 기술적 접근을 목적으로 제공된 것입니다. cTrader Store는 중개인이 아니며, 투자 조언, 개인별 추천 또는 향후 성과에 대한 어떠한 보장도 제공하지 않습니다.

이 작성자의 상품 더 보기

지표
Volume
Imbalance
+5
Spot Institutional Order Flow with Proportional Volume Bubbles & Integrated Cumulative Volume Delta (CVD) Intelligence.
지표
Forex
EURUSD
+5
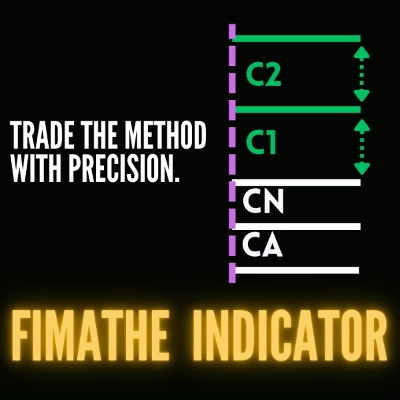
Fimathe Indicator - Fimathe PCM - Automated Trend Channels & Levels — Ideal for live trading and backteting
"ZigXRay" 로고
최고 평점
4.6
(5)
$29
/
$49
지표
CHOCH
Key Levels
+5
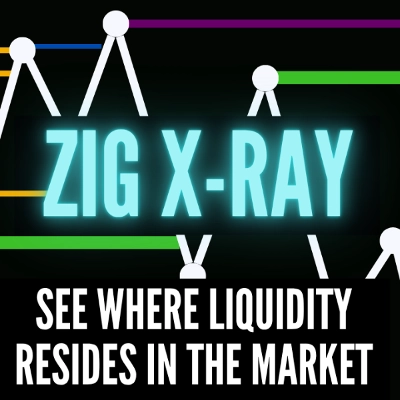
ZigZag Market Structure Identifier - Multi-Layer Scanner: Convergent Pivot Detection, 4-TF Overlay & Naked Chart Mode.
cBot
Fixed Lot
TP Manager
+5
Hotkeys Trading Assistant - Professional Shortcut Assitant with Risk Manager, Hotkeys & Lot Sizing.
"DrbcLevels" 로고
최고 평점
4.0
(4)
$19
/
$29
지표
Key Levels
Break & Retest
+5
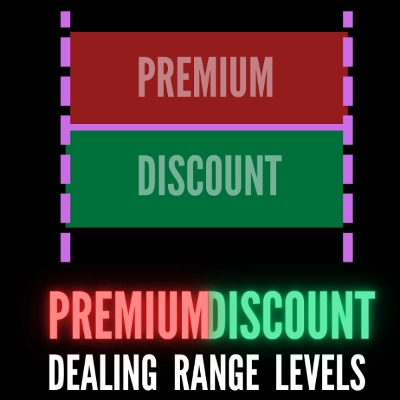
Premium Discount Levels - Professional Dealing Range Zones with Draggable Lines, Alerts, Wartermark & Backtest Mode.
데스크톱 플러그인
Risk/Reward
Trade Journal
+5
cTrader Journal - Automatic Trade Capture. Offline Reviews. No Subscription.
지표
CHOCH
Inducement
+5
TradeLens - Frame the Trade. Refine the Entry. Two Timeframes. One Decision.
"fvg_levels" 로고
최고 평점
4.0
(4)
$19
/
$29
지표
Key Levels
Order Block
+5
FVG Levels — Auto-Detection of Multi-Timeframe Fair Value Gaps & GAPs, Smart Filters and Liquidity Zone Monitoring

좋아하실 만한 다른 항목

지표
Bollinger
Jurik Moving Average (Jurik's Moving Average) triple adaptive filter with unique Jurik smoothing and dynamic factor.
지표
Forex
Crypto
+3
ICT Advanced Swings Indicator – Multi-Timeframe Precision
지표
ATR
RSI
+5
Fusion trend line with a layered cloud, BULL and BEAR labels, scored re-entry triangles and exit markers.
지표
Fair Value Gap
Auto-draws every Fair Value Gap on any timeframe and removes it once filled. Clean, fast, free. Built for cTrader.
지표
Forex
The cTrader Market Sessions Alerts Indicator marks global sessions, highlights key levels, and sends real-time alerts.
지표
Forex
BTCUSD
+13
Multi-symbol Inside Bar Scanner with dashboard & breakout alerts
지표
Forex
Crypto
+3
Perfect Trend
지표
Supertrend
Moving Average
Easy Trade: Trend & Breakout Indicator for cTrader
지표
Boost your trading with Candlestick Patterns for cTrader – auto-detect key signals for smarter, faster decisions!
지표
EMA
Volume
+4
Advanced volume‑profile tool with delta, HVN/LVN zones, and precise POC‑based trade signals.
지표
SMA
Volume
+3
Stoc​h PRO Quad Rotation Signal (QRS) is an advanced technical analysis indicator developed for cTrader.
"Vwap Bands" 로고
최고 평점
4.5
(4)
$19
/
$29
지표
VWAP
Moving Average
Vwap Bands it is highly sought after by professional traders because it includes Standard Deviation Bands
지표
AI
ATR
+26
MacD Custom Indicator-Multiple Time Frame
지표
AI
ATR
+27
Market Cipher B
지표
BOS
EMA
+5
Free chart-overlay indicator for confirmed BOS, CHoCH and ATR-filtered Fair Value Gap analysis.
지표
SMC
Forex
+1
Visualize Asia session range with customizable lines for high, low, mid, start, and end.
지표
Plot higher-timeframe Bollinger Bands for clearer structure, pullback zones, and breakout signals—without switching char
지표
Key Levels
Every major liquidity level drawn for you: PDH/PDL, PWH/PWL, PMH/PML and more. Same price on every timeframe. Free.

가격

가입일 09/02/2026
28
판매
173
무료 설치