present
Sign up and get $50 off your first purchase
Trading product for TradeLens Indicator Chart UI Tools Key Levels, image 1
TradeLens
Indicator
Version 1.0, Sep 2026
Windows, Mac
Trading product for TradeLens Indicator Chart UI Tools Key Levels, image 2
Trading product for TradeLens Indicator Chart UI Tools Key Levels, image 3
Trading product for TradeLens Indicator Chart UI Tools Key Levels, image 4
Trading product for TradeLens Indicator Chart UI Tools Key Levels, image 5
Trading product for TradeLens Indicator Chart UI Tools Key Levels, image 6
Trading product for TradeLens Indicator Chart UI Tools Key Levels, image 7
Trading product for TradeLens Indicator Chart UI Tools Key Levels, image 8
Since 09/02/2026
20
Sales
152
Free installs

Description

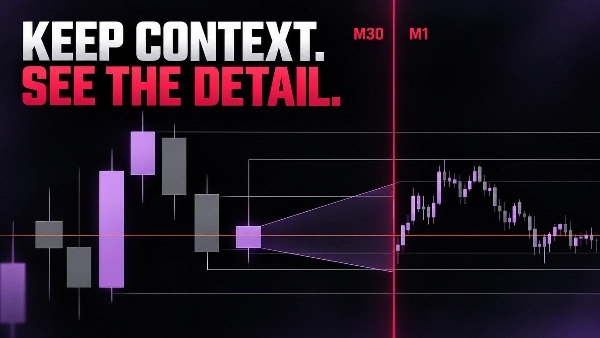
TRADELENS - KEEP CONTEXT. SEE THE DETAIL.

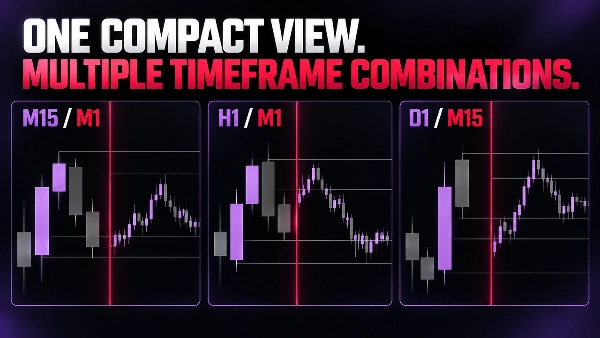
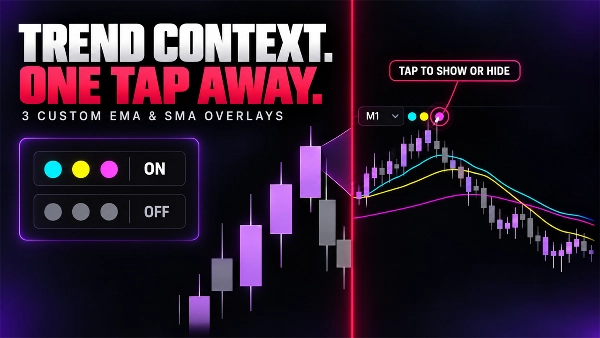
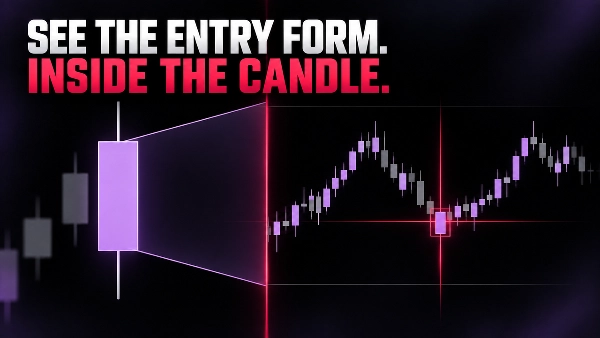
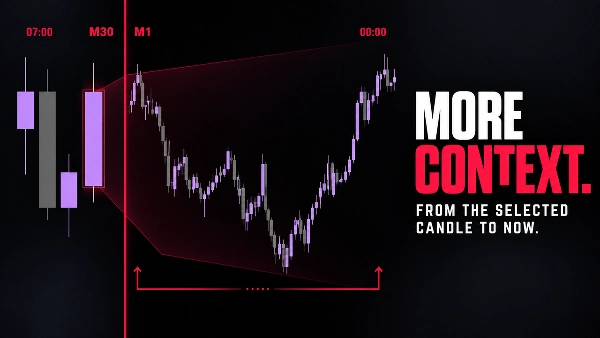
TradeLens places a compact lower-timeframe candle view directly inside your current chart. The original chart remains your higher-timeframe context; the detail panel shows how price is developing inside the selected context candle.

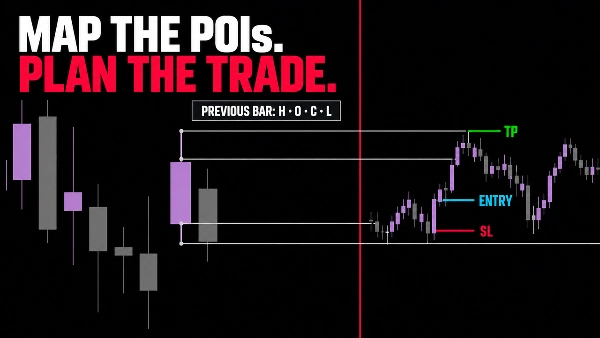
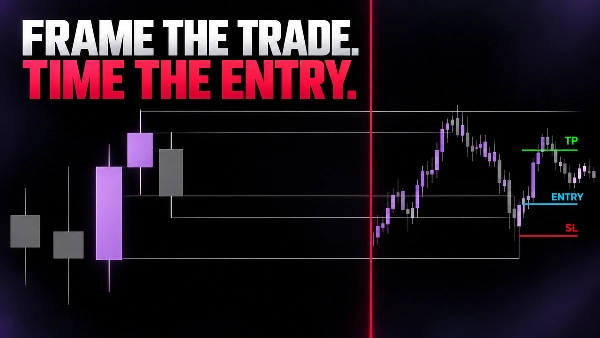
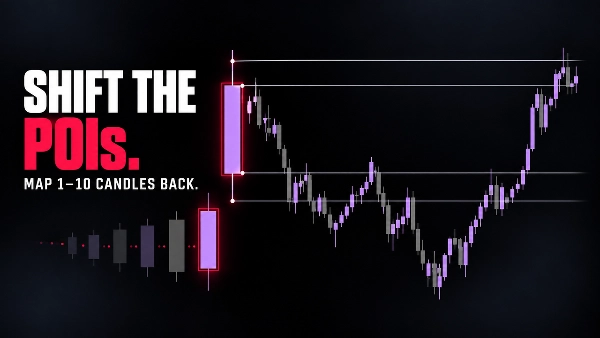
Use the current forming candle by default, or shift back to inspect an earlier context candle. You can frame the active setup with optional POI's (rays) at the previous closed bar's High, Low, Open and Close, then study the lower-timeframe movement without leaving the chart.

WHAT TRADELENS HELPS YOU SEE

  • Higher-timeframe structure and lower-timeframe detail in the same window.
  • The progression of the current context candle at a finer scale.
  • Previous-bar OHLC points of interest across the chart.
  • Compact combinations such as M15/M1, M30/M1, H1/M1, D1/M15 and D1/M30.
  • A cleaner way to refine entry timing while preserving context.

SIMPLE, VISUAL CONTROLS

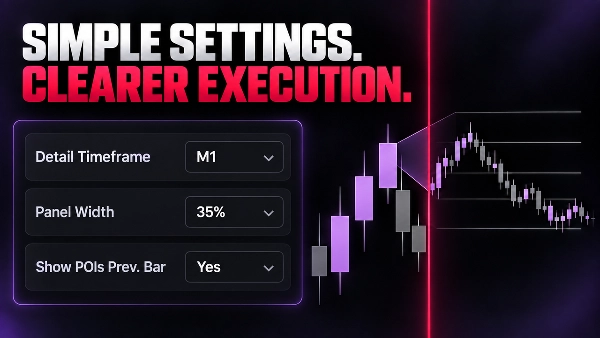
  • Detail timeframe and context candle shift.
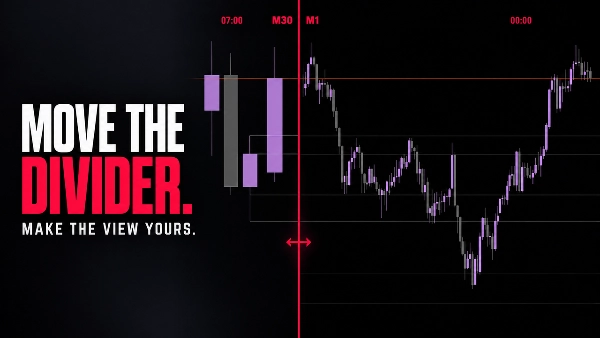
  • Detail-panel width, background and opacity.
  • Bull, bear, separator and label colors.
  • Optional previous-bar POIs with configurable color and thickness.

The detail timeframe must be smaller than the chart timeframe. If the combination is invalid, TradeLens hides its visualization and displays a clear configuration banner.

TradeLens is a visual analysis tool. It does not place, modify or manage orders. Examples shown in the gallery illustrate a chart-reading workflow and are not trade recommendations or guarantees of performance.


Summary

AI summary
TradeLens is a chart visualization tool designed to integrate two timeframes within a single trading chart. It embeds a compact lower-timeframe candle view inside the current higher-timeframe chart, allowing traders to observe detailed price action within the context of a broader market structure. Users can analyze the progression of the current or previous context candles at a finer scale without switching charts.

Key features include optional points of interest (POIs) marking the previous bar’s Open, High, Low, and Close levels, customizable visual settings such as detail panel size, background opacity, and color schemes for bullish, bearish, and separator elements. TradeLens supports common timeframe combinations like M15/M1, M30/M1, H1/M1, D1/M15, and D1/M30, ensuring the detail timeframe is always smaller than the context timeframe.

This tool facilitates refined entry timing by preserving higher-timeframe context while providing granular lower-timeframe insights. It is a visual analysis indicator and does not execute or manage trades. TradeLens is tagged under market structure and chart UI tools, supporting analysis related to key levels, liquidity sweeps, market structure changes, and inducements.
Indicator profile
Indicator category
Market structure (SMC)
Output type
Visualisation
Data requirements
Bars only

Customer reviews

0.0
Reviews: 0
Customer reviews
No reviews for this product yet. Already tried it? Be the first to tell others!

Discussion

FAQ

Chart UI Tools
Key Levels
Liquidity Sweep
CHOCH
Inducement
Market Structure
Liquidity Grab
Products available through cTrader Store, including trading bots, indicators and plugins, are provided by third-party developers and made available for informational and technical access purposes only. cTrader Store is not a broker and does not provide investment advice, personal recommendations or any guarantee of future performance.

More from this author

Indicator
BOS
CHOCH
+5
Spot market structure shift with ease, overlay timeframes, avoid false breakouts with open close pivots, hide chart bars
Indicator
Volume
Imbalance
+5
Spot Institutional Order Flow with Proportional Volume Bubbles & Integrated Cumulative Volume Delta (CVD) Intelligence.
Indicator
CHOCH
Key Levels
+5
ZigZag Market Structure Identifier - Multi-Layer Scanner: Convergent Pivot Detection, 4-TF Overlay & Naked Chart Mode.
Indicator
Forex
EURUSD
+5
Fimathe Indicator - Fimathe PCM - Automated Trend Channels & Levels — Ideal for live trading and backteting
cBot
Fixed Lot
TP Manager
+5
Hotkeys Trading Assistant - Professional Shortcut Assitant with Risk Manager, Hotkeys & Lot Sizing.
Desktop plugin
Risk/Reward
Trade Journal
+5
cTrader Journal - Automatic Trade Capture. Offline Reviews. No Subscription.
Indicator
Key Levels
Break & Retest
+5
Premium Discount Levels - Professional Dealing Range Zones with Draggable Lines, Alerts, Wartermark & Backtest Mode.
Indicator
Key Levels
Order Block
+5
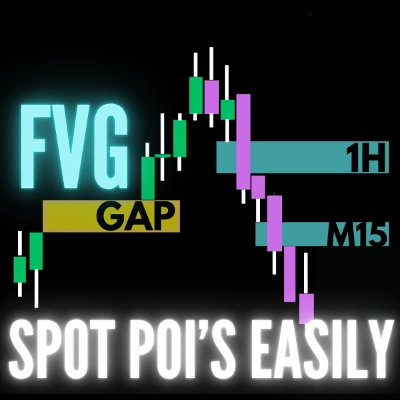
FVG Levels — Auto-Detection of Multi-Timeframe Fair Value Gaps & GAPs, Smart Filters and Liquidity Zone Monitoring

You may also like

Indicator
ATR
RSI
+4
RSI bands drawn on price, confluence-scored BUY/SELL signals, an ATR stop with three targets
Indicator
RSI
Forex
+12
Indicator pattern signal moment
Indicator
Signal
This Fair Value Gap (FVG) indicator is a technical analysis on multi-timeframe.
Indicator
Engulfing
Fibonacci
+4
Six higher-timeframe candle sets on one chart, with liquidity sweep detection and swept levels.
Indicator
ATR
RSI
+4
Adaptive Ichimoku with nine-factor confluence scoring, five signal types, smart TP/SL and an MTF panel.
Indicator
Forex
Fibonacci
+2
Enhance your trading with customizable alerts and dynamic visual tools for trendlines, Fibonacci levels, and more.
"IVB 2.0" logo
Top-rated
4.6
(5)
$19
Indicator
IVB 2.0 is an indicator that works on the strategy of imbalance of the maximum volatility box of indices
Indicator
Forex
Indices
+1
Professional Fair Value Gaps with multitimeframe spot on
Indicator
AI
ATR
+27
Support and Resistance with signals
Indicator
BOS
MSS
+5
Your entire ICT session map, structure engine, and key levels — No manual work. One indicator. Every session!
Indicator
Volume
Key Levels
+1
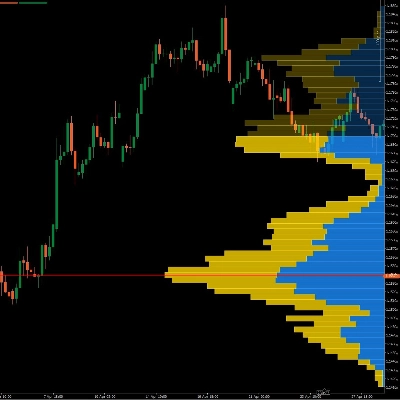
Fixed-grid volume profile: bull and bear volume at every price level, with Point of Control and value area.
Indicator
Forex
BTCUSD
+11
Next-gen Volume Oscillator using Hyperbolic Tangent math. No repainting. Includes arrows, alerts, and overlay mode 🎯
Indicator
AI
ATR
+5
"Advanced VSA & CVD indicator with 'A+ Setup' filtering based on Support & Resistance levels."
Indicator
Prop
E7 BBKG indicator with 80% plus accuracy used to show both, possible reversal and trend.
Indicator
Indices
Commodities
The Advanced CCI & EMA Indicator combines the CCI with 40 & 80 EMA logic to generate precise arrows signaling direction
Indicator
CHOCH
Key Levels
+5
ZigZag Market Structure Identifier - Multi-Layer Scanner: Convergent Pivot Detection, 4-TF Overlay & Naked Chart Mode.
Indicator
RSI
BTCUSD
+5
Traders Dynamic Index (TDI) — Divergence Edition
Indicator
AI
RSI
+7
EMA MTF TREND PRO - Multi-timeframe trend analysis overlay indicator, 6 timeframes - in one table with ADX

Price

Since 09/02/2026
20
Sales
152
Free installs