Description
🚀 10,000+ traders already use our TOP indicators🏆
👉 Get all our TOP systems here:
_______________________________________________
📌 Market Structure Indicators
· ✅ AdvancedMarket Structure: Bos, Choch, SwinLevels, Order Blocks, Market Structure& Liquidity Finder
· 🔄 Dynamic Market StructureAnalysis of Turning Points
· 🧱 Order Block
· ⚖️ Market Imbalance
· ⛓️ BOS & CHOCH
· 🧠 ICT Power of 3
_______________________________________________
🔚 Smart Exit Systems
_______________________________________________
📐 ZigZag Indicators
· 🔍 ZigZag Price LiquidityProjection
· ➖ ZigZag
_______________________________________________
🧱 Support & Resistance Indicators
· 🟩 SmartTrend Support &Resistance Lines
· 🧱 All Support and ResistanceLevels
_______________________________________________
📊 Trend & Channel Indicators
· 📊 Supertrend
_______________________________________________
💧 Volume & Liquidity Tools
_______________________________________________
⚡ Momentum & RSI Indicators
· 🔎 Multi-Level Candle Bias
Tracker
_______________________________________________
🔮 Prediction & Projection Tools
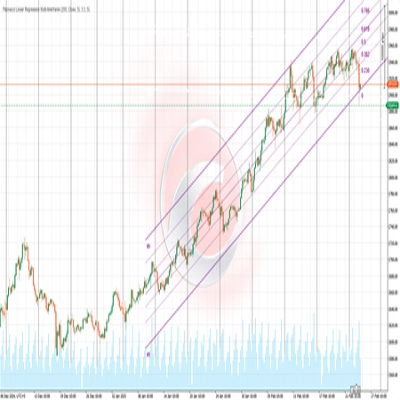
· 📐 Prediction Based on Linreg& ATR
· 📏 Fibonacci Linear RegressionMulti-timeframe
· 📈 Volume-Powered Market Flow Projector
📊 Pivot Breakout Detector
🎯 **What is it and what is it for?**
https://ctrader.chartshots.net/c/68e935cb9f52a
The Pivot Breakout Detector is an advanced technical indicator designed to automatically identify significant breakouts from price consolidation zones. This indicator analyzes the historical behavior of the market to detect areas where the price has repeatedly "bounced" (creating resistance or support) and alerts you when a breakout with momentum finally occurs.
**Main Utility:**
• Identify trading opportunities in confirmed breakouts
• Avoid false breakouts through multiple-touch validation
• Visualize critical dynamic support and resistance zones
• Capture explosive moves after consolidations
________________________________________
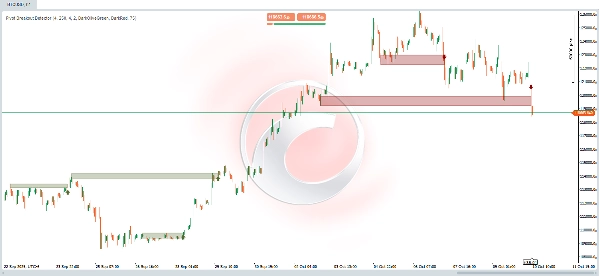
🔍 **How Does It Work? - The Underlying Logic**
**Phase 1: Detection of Significant Pivots**
https://ctrader.chartshots.net/c/68e9368eb6e7c
The indicator constantly scans the chart looking for pivot points - local highs and lows that represent where the price changed direction. These pivots are fundamental because they mark levels where there was historically buyer or seller interest.
**Phase 2: Identification of Consolidation Zones**
Once pivots are detected, the indicator groups those that are close to each other (within a configurable threshold). When multiple pivots are concentrated in a narrow price range, this indicates a consolidation zone - an area where the price has been repeatedly rejected.
**Phase 3: Breakout Confirmation**
The indicator patiently waits until the price manages to:
1. Close above (bullish breakout) or below (bearish breakout) the identified zone
2. Do so with a strong directional candle (close far from the open)
3. Surpass the recent short-term high/low
**Phase 4: Final Validation**
Before generating the signal, it verifies that:
• There are enough previous "touches" in the zone (configurable minimum)
• The price has not recently surpassed that level
• The opening of the breakout candle is within the valid range
________________________________________
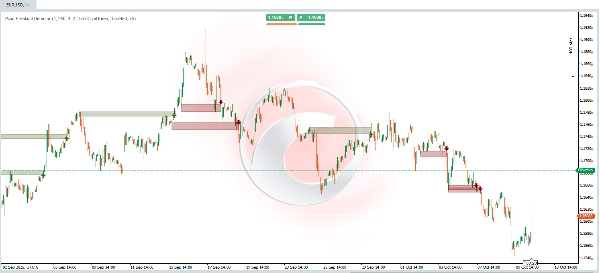
📈 **Visual Interpretation**
**Elements on the Chart:**
🟢 **Olive Green Rectangles (Bullish Breakout)**
• Shaded green area: Represents the resistance area that was surpassed
• Upper and lower borders: Delimit the previous consolidation zone
• Horizontal extension: Shows from when the zone was formed until the moment of breakout
🔴 **Dark Red Rectangles (Bearish Breakout)**
• Shaded red area: Represents the support area that was broken
• Function: Identical to the green rectangles but for bearish movements
⬆️ **Green Upward Arrow**
• Location: Below the candle that confirmed the bullish breakout
• Meaning: Potential long entry signal (buy)
• Interpretation: The price has broken resistance with force
⬇️ **Red Downward Arrow**
• Location: Above the candle that confirmed the bearish breakout
• Meaning: Potential short entry signal (sell)
• Interpretation: The price has broken support with force
________________________________________
⚙️ **Configurable Parameters**
1. **Swing Detection Length (Default: 4)**
• What it controls: The analysis period for detecting significant pivots
• Low values (2-3): Detects smaller and more frequent pivots, generating more signals but potentially more false ones
• High values (7-10): Detects only major and more reliable pivots, generating fewer signals but of higher quality
• Recommendation: 4 for daily trading, 8-10 for swing trading
2. **Zone History Bars (Default: 250)**
• What it controls: How many candles back the indicator "remembers" pivots to form zones
• Low values (30-100): Focuses on recent zones, more reactive to structure changes
• High values (200-300): Considers older historical zones, useful for identifying long-term levels
• Recommendation: 150-200 for intraday timeframes, 250-300 for daily or higher
3. **Zone Width Percent (Default: 4%)**
• What it controls: The thickness of the "tolerance area" for grouping pivots into a zone
• Low values (1-2%): Very precise zones, requires multiple almost exact touches
• High values (5-8%): Wider zones, more permissive when grouping nearby levels
• Recommendation: 2-3% for low volatility instruments (forex majors), 4-6% for cryptocurrencies
4. **Min Swing Touches (Default: 2)**
• What it controls: Minimum number of times the price must have "tested" the zone before considering it valid
• Low values (1-2): More signals, including less established zones
• High values (3-5): Only strongly confirmed zones, fewer signals but more reliable
• Recommendation: 2 for active trading, 3-4 for more conservative positions
________________________________________
📊 **Practical Examples**
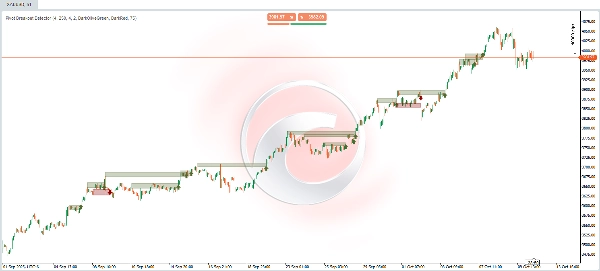
🔵 **Bullish Breakout Example**
**Previous Context:** The price has been oscillating for several sessions between $48.50 and $49.20. During this consolidation period, the price attempted to surpass the $49.00 level on three distinct occasions, but each time it was rejected, creating high pivots at practically the same level.
**Zone Formation:** The indicator automatically identifies these three high pivots concentrated between $48.90 and $49.10, creating a well-defined "resistance zone". This zone is drawn as a semi-transparent olive green rectangle that extends horizontally from the first touch to the present.
**Breakout Moment:** In the current session, the price opens at $48.80, rises strongly and closes at $49.35. This candle meets all the criteria:
• ✅ Closes above the resistance zone ($49.10)
• ✅ It is a strong bullish candle (close well above open)
• ✅ Surpasses the high of the last 4 previous candles
• ✅ The zone had at least 2-3 confirmed touches
**Generated Signal:** A green arrow pointing upwards appears below the breakout candle, and the olive green rectangle "closes" at that moment, visually showing the entire structure: from where the resistance was formed to where it was broken.
**Trader Interpretation:** This is a potential buy signal. The breakout suggests that buyers finally overcame the resistance that had contained the price, and a more sustained bullish move could begin. Traders may consider:
• Long entry at the close of the candle or on a pullback to the broken zone (now support)
• Stop loss below the zone ($48.70)
• Target based on the height of the zone projected upwards
________________________________________
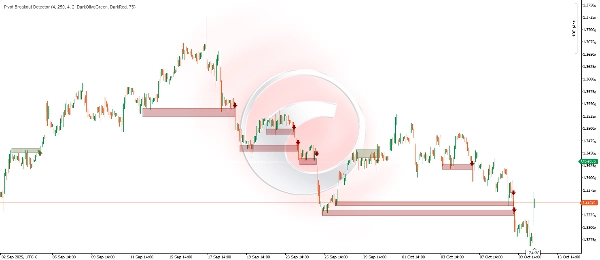
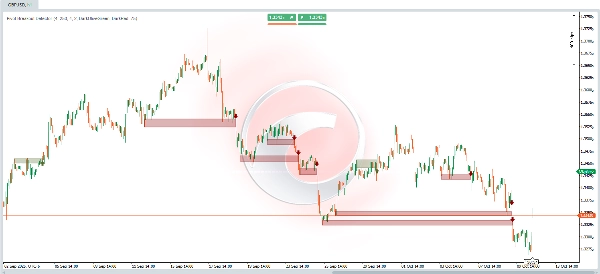
🔴 **Bearish Breakout Example**
**Previous Context:** The price has been in a distribution phase around $102.00 for almost two weeks. On four different occasions, the price attempted to fall below $101.50 but was rescued by buyers, creating low pivots in a very narrow zone.
**Zone Formation:** The indicator detects these four low pivots grouped between $101.40 and $101.70, identifying a clear institutional "support zone". The area is marked with a semi-transparent red rectangle that documents the entire history of defense at this level.
**Breakout Moment:** During a volatile session, the price opens at $101.80, negative news impacts the market, and the price collapses closing at $100.95. This breakout candle presents:
• ✅ Closes clearly below the support zone ($101.40)
• ✅ It is a powerful bearish candle (close well below open)
• ✅ Breaks the low of the last 4 sessions
• ✅ The support had been tested 4 times previously
**Generated Signal:** A red arrow pointing downwards appears above the breakout candle. The dark red rectangle is completed, visually documenting the entire formation period and the exact point of support collapse.
**Trader Interpretation:** This is a potential sell signal. The breakout indicates that sellers finally broke the floor that was supporting the price, suggesting a bearish trend could continue. Considerations include:
• Short entry at the close or on a failed pullback to the broken zone (now resistance)
• Stop loss above the zone ($102.00)
• Target calculated by projecting the height of the zone downwards
________________________________________
💡 **Usage Tips**
✅ **Best Practices:**
1. Confirm with volume: Genuine breakouts are usually accompanied by an increase in volume
2. Trend context: Breakouts in the direction of the major trend have a higher probability of success
3. Wait time: Not all signals must be traded immediately; wait for additional confirmation if necessary
4. Risk management: Always use a stop loss based on the structure of the broken zone
Summary
Key features include:
- Automatic detection of significant pivot points and consolidation zones.
- Breakout confirmation based on candle strength and price action.
- Validation requiring multiple prior touches of the zone to reduce false signals.
- Visual cues on the chart: olive green rectangles and upward arrows for bullish breakouts; dark red rectangles and downward arrows for bearish breakouts.
- Configurable parameters such as swing detection length, zone history depth, zone width, and minimum touches to tailor sensitivity and reliability.
The indicator supports various markets including Forex, cryptocurrencies, stocks, and major symbols like BTCUSD, EURUSD, GBPUSD, XAUUSD, and NAS100. It aids traders in spotting confirmed breakout opportunities, visualizing critical price levels, and managing risk with structural stop-loss placement.