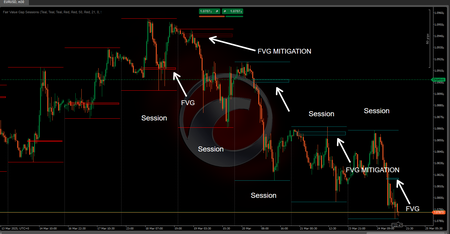
Pinescriptlabs Store indicators: Pinescriptlabs Store cBots : (cBot) Gold & BTC BreakoutSession Pivots(new)
PRICE ACTION (New)
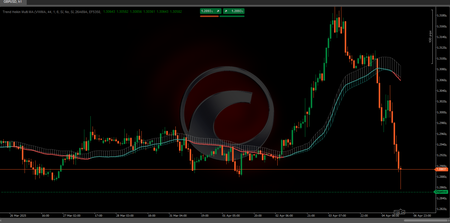
Trailing Smart Algorithm (new)
Prediction Based on Linreg & ATR
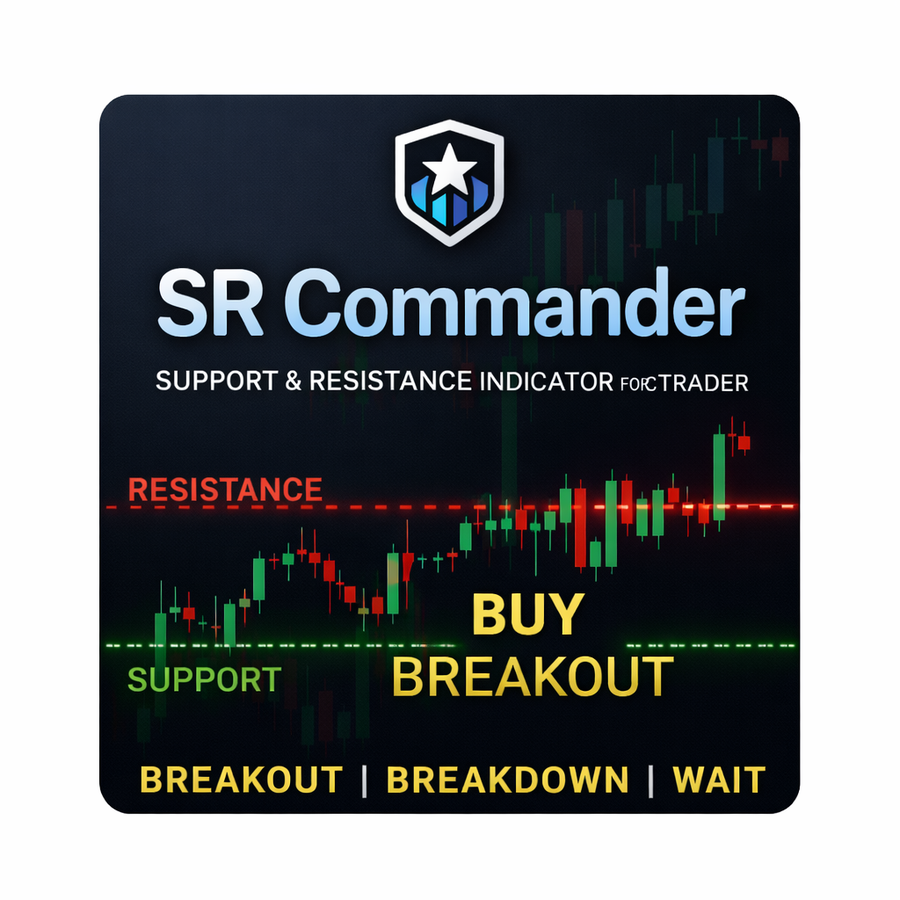
SmartTrend Support &
Resistance
Lines
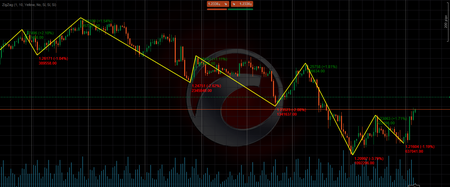
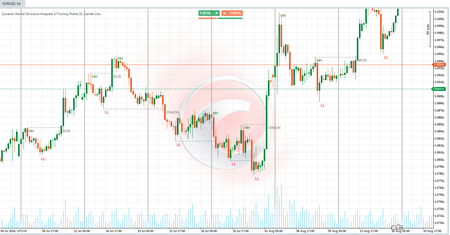
Dynamic
Market Structure
Analysis
of
Turning
Points
Fibonacci
Linear
Regression
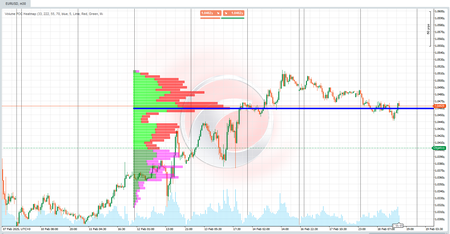
Multi-timeframe
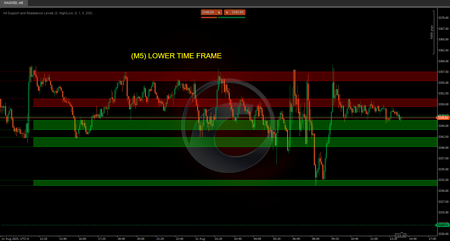
Auto
Support and
Resistance
Trend
Lines
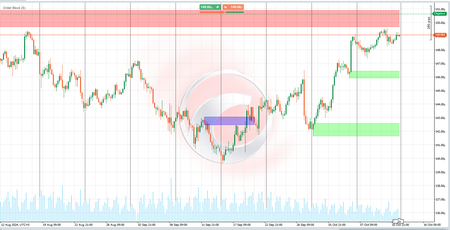
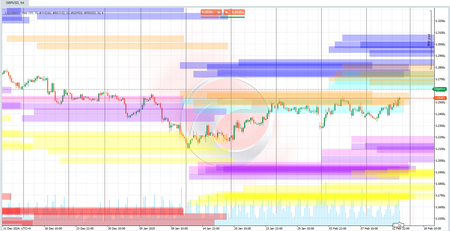
All
Support and
Resistance
Levels
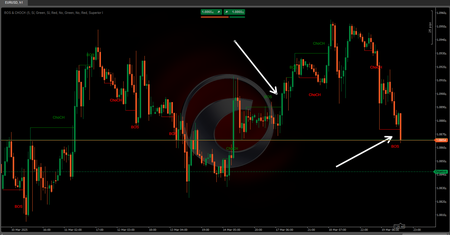
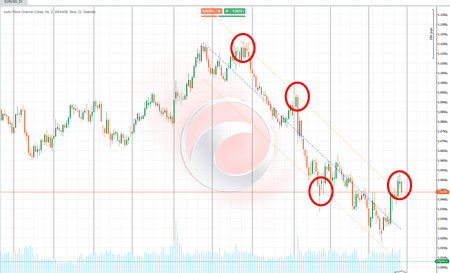
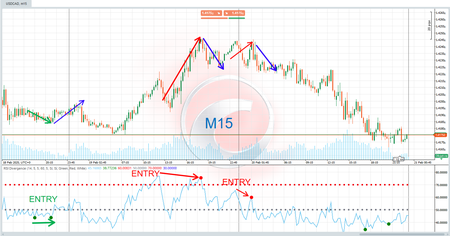
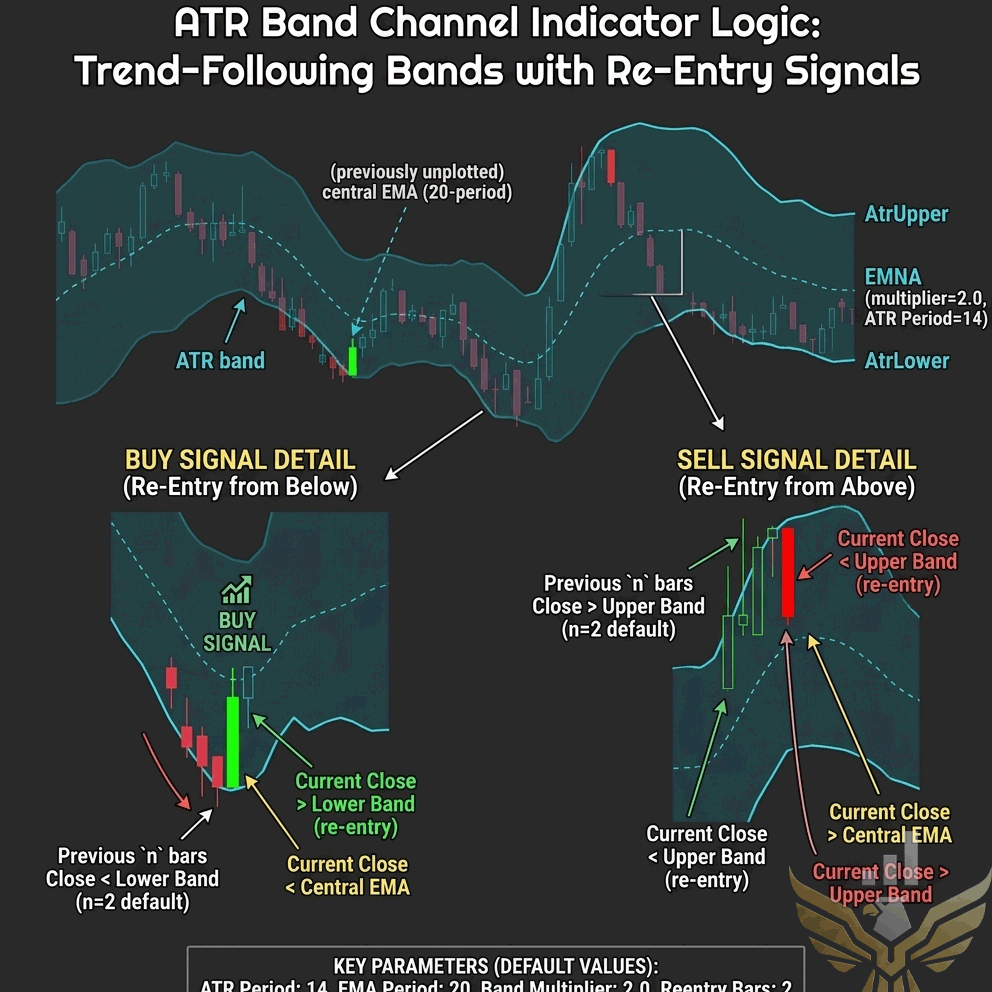
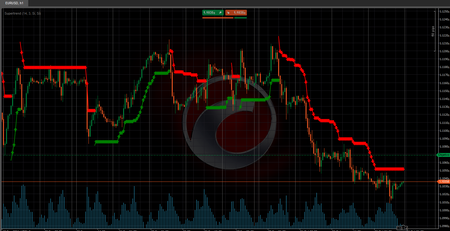
🚀 **Trend-Following Algorithm** that leverages the **Average True Range (ATR)** 📊 to define a price channel 📈 and determine trend direction (bullish 🟢 or bearish 🔴). The indicator changes colors and draws lines based on the trend, making it easy to visualize shifts in market momentum. 💹
### 🔧 **Inputs**:
1. **ATR Periods** ⏳:
- Defines the number of periods to calculate the **Average True Range**. This affects the indicator's sensitivity, helping you capture market movements faster or slower.
2. **ATR Multiplier** 🔍:
- Adjusts the distance between the trend lines 📉 based on market volatility 🌊. A higher value widens the channel, reducing false signals but giving a clearer view of major market moves. 📐