Indicator
RSI
Breakout
XAUUSD
ATR
Commodities
Supertrend
Crypto
BTCUSD
Prediction Based on Linreg & ATR
"Prediction Based on Linreg &  ATR" logo
03/09/2025
125
Desktop
"Prediction Based on Linreg &  ATR" uploaded image"Prediction Based on Linreg &  ATR" uploaded image"Prediction Based on Linreg &  ATR" uploaded image"Prediction Based on Linreg &  ATR" uploaded image"Prediction Based on Linreg &  ATR" uploaded image

Pinescriptlabs Store indicators:                        🤖Pinescriptlabs  Store cBots :


 ICT Power of 3  (cBot) Gold & BTC BreakoutSession Pivots(new)YieldShield

SmartTrend Support &
Resistance Lines
       

Fair Value Gap Sessions                      
       

ZigZag

 BOS & CHOCH

RSI Trend Trigger

Channel Breakout System

Supertrend

Market Imbalance

Adaptive Trend Channel 

Dynamic Market Structure
Analysis of Turning Points

Order Block

Fibonacci Linear
Regression Multi-timeframe

Volume POC Heatmap

Dynamic RSI

Momentum Fair Value Gap

Market Flow Projection

Dynamic Trend Gradient

Multi-Level Candle Bias
Tracker

Zig-Zag Extremity Tracker

Reactive Moving Average

Auto-Trend Channel

Auto Support and
Resistance Trend Lines

All Support and
Resistance Levels

Leverage Liquidation Map

Zones Supply Demand

Dynamic Range Momentum


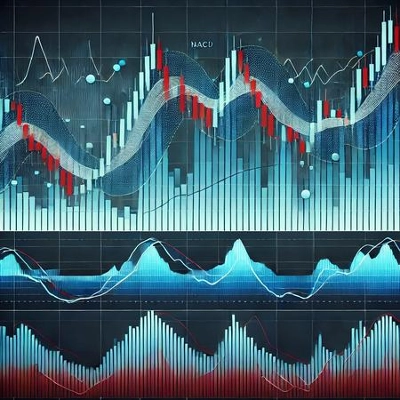
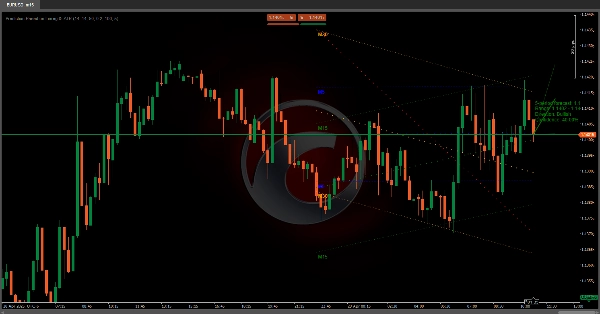
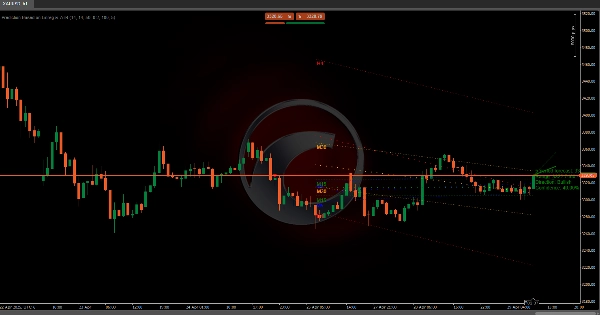
📈 Multi-Timeframe Regression Channel & ATR Prediction Algorithm

This system predicts an asset's potential price movement by combining multi-timeframe trend analysis 📊, market volatility 📉, and technical indicator confirmation ✅. Its goal is to project a future price range with measurable confidence, ideal for identifying high-probability risk-reward opportunities 💰.

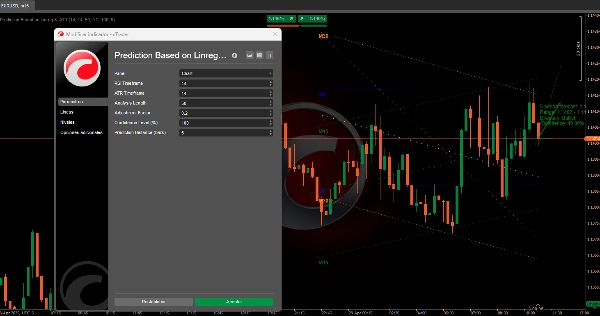
🔧 How It Works Step by Step

1️⃣ Multi-Timeframe Trend Analysis

  • Regression Channels Across Timeframes:
    The algorithm simultaneously analyzes four different timeframes (from short to long-term). For each:
    • Calculates a statistical trend line based on historical price behavior.
    • Defines a prediction channel around this line (using past volatility to set upper/lower bounds).
  • Hierarchical Influence:
    Shorter timeframes carry more weight in the final direction, reflecting their sensitivity to recent movements.

2️⃣ Volatility Integration (ATR) 🌊

  • Dynamic Volatility Adjustment:
    Predictions adapt to current market conditions:
    • High volatility → Wider projections
    • Low volatility → Conservative adjustments
  • Future Range Scaling:
    The prediction band automatically adjusts based on expected volatility.

3️⃣ Trend Confirmation System ✅

Combines four key signals to validate or challenge the regression-based direction:

  • Moving Average Crosses (trend confirmation)
  • Momentum Oscillators (strength assessment)
  • Volatility Indicators (overbought/oversold detection)
  • Divergence Analysis (trend reversal clues)
  • Output: A scoring system that reinforces or questions the predicted trend.

4️⃣ Confidence Calculation 🎯

  • Timeframe Alignment:
    Confidence increases when trends agree across timeframes.
  • User-Defined Threshold:
    Traders can set a minimum confidence level to filter only high-certainty signals.

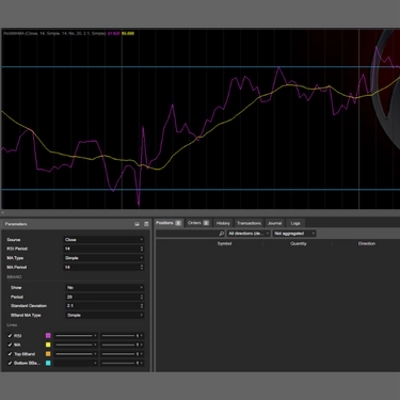
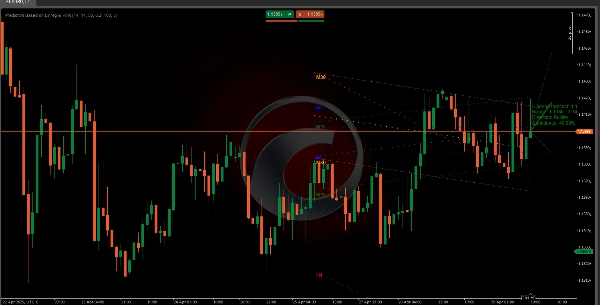
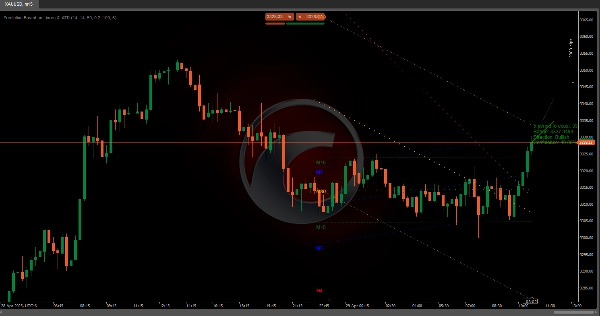
5️⃣ Intuitive Visualization 📉📈

  • Prediction Line:
    Shows the central expected path (green = bullish 🟢, red = bearish 🔴, gray = neutral ⚪).
  • Range Bands:
    Highlight the most probable price movement zone, adjusted for volatility.
  • Info Label:
    Summarizes projected price, range, direction, and confidence level.

🌟 Key Advantages

  • Multi-Dimensional Approach: Combines trend, volatility & momentum to reduce false signals.
  • Self-Adjusting: Adapts to choppy or trending markets automatically.
  • Transparent Metrics: Quantifiable confidence helps manage expectations.

📌 Practical Example

If the system detects:

  • Bullish trend in short timeframes + momentum confirmation
  • Low recent volatility
  • Strong timeframe agreement
    → Projects a price rise with a tight band and high confidence (e.g., 85%) 🚀
0.0
Reviews: 0
Customer reviews
No reviews for this product yet. Already tried it? Be the first to tell others!
More from this author
Indicator
RSI
Breakout
XAUUSD
+6
ZigZag
ZigZag filters noise, spots trends, patterns, pivots, aiding analysis, trade management, and confirmations. 📉📈
Indicator
RSI
Breakout
XAUUSD
+6
Order Block
Identify bullish and bearish Order Blocks to spot key support/resistance levels and potential trend reversals! 📈🔄
Indicator
RSI
Breakout
XAUUSD
+5
Auto-Trend Channel
Adaptive trend channel using linear regression and Pearson correlation for dynamic support, resistance, and trends.
Indicator
RSI
XAUUSD
Breakout
+5
BOS & CHOCH
Market structural patterns , specifically the concepts of Change of Character (ChoCH) 🔄 and Break of Structure (BoS) 💥
Indicator
RSI
Breakout
XAUUSD
+5
Zones Supply Demand
📊Zones Supply & Demand: Identifies key price levels with high volume concentration, marking Supply/Demand Zones & Marke
Indicator
RSI
Breakout
Supertrend
All Support and Resistance Levels
"Identify key market zones and visualize support/resistance from multiple timeframes on a single chart.
Indicator
RSI
Breakout
XAUUSD
+6
Volume POC Heatmap
📊 Shows volume by price levels, highlights POC, and key zones. Identifies dynamic support/resistance and imbalances.
Indicator
RSI
Breakout
XAUUSD
+5
Supertrend
💹 Define a price channel 📈 and determine trend direction (bullish 🟢 or bearish 🔴).
Indicator
RSI
Breakout
XAUUSD
+6
Fair Value Gap Sessions
identify and highlight temporary market inefficiencies known as "fair value gaps" 🚨 within specific trading Sessions.
Indicator
RSI
Breakout
XAUUSD
+4
Dynamic Market Structure Analysis of Turning Points
Identify market structure effortlessly with swing highs, lows, CHoCH, and BOS levels for smart trading decisions! 📊🔍"
Indicator
Indices
RSI
XAUUSD
+7
RSI Divergence
Detects bullish and bearish divergences
Indicator
RSI
Breakout
Supertrend
Trend Heikin Multi MA
🚀 TrendHeikinMultiMA: Advanced trend detection using Heikin-Ashi smoothing & MAs! Eliminates noise, confirms real trend
Indicator
RSI
Breakout
XAUUSD
+4
Multi-Level Candle Bias Tracker
Price direction by calculating the probability of reaching new highs/lows. Shows levels & stats📈
Indicator
RSI
Breakout
Supertrend
Leverage Liquidation Map
📊 Liquidation Map: Potential areas where highly leveraged investors might face liquidations.
Indicator
RSI
Breakout
Supertrend
Market Trend OB
Price action to detect when the market changes trend (MSB) and defines, order blocks , ZigZag etc.📊
Advanced Market Structure Bos,Choch,SwinLevels, Order Blog
Advanced price action tool that combines multiple technical analysis concepts
Indicator
RSI
Breakout
Supertrend
Swing Levels
🔍 Automatically detect support and resistance levels based on "swings" or pivots
Indicator
RSI
Breakout
Supertrend
Zig-Zag Extremity Tracker
Dynamically adjusts regression channels based on ZigZag extremes, resetting when price breaks bands to track real trends
You may also like
Indicator
NAS100
NZDUSD
XAUUSD
+13
Chandelier Exit
Optimize exits with Chandelier Exit! Visualize stop-loss points dynamically for improved trading precision and safety.
Ichimoku Kinko Hyo
Ichimoku Kinkō Hyō with fixed shift to 25 as Ctrader calculate it from 0 and values was wrong for Chikou Span and Kumo.
Indicator
Breakout
Scalping
SSL Channel
SSL Channel — Trusted by price action traders to stay on the right side of the trend.
Support Resistance Zones
Support and Resistance.
Indicator
Breakout
Fx4U.Multi TimeFrame Support & Resistance
Allow trader to visualize Support & Resistance across different timeframes,give trader an overview of the current market
indicator
Multi-timeframe candlesticks!
Indicator
RSI
Breakout
Signal
+1
Dynamic Trend Gradient
Identifies trends with moving averages & volatility. Base levels = bullish 🐂 or bearish 🐻 signals. Reversals detected!
TrendMagicOptimized
Clean trend indicator using CCI & ATR. Highlights up/down trends with adaptive, no-repaint lines.
OHLC PRO by LudwigICT
OHLC PRO – Advanced Session & Market Structure Tool
Premium Discount Zones
Premium Discount Zones" spots key areas (🟣Premium/🟢Discount) using recent highs/lows & volume..............
Indicator
Bollinger
E7 Indicators Free Overlays
Bollinger Band Cloud, Heiken Ashi, Trend Follower and Parabolic SAR.
Indicator
Bollinger
E7 Indicators Free Studies
ADXR, KDJ, SineWave, Bollinger Band Volatility and AEOscillator.
Indicator
RSI
Breakout
XAUUSD
+5
Shielded Trend
Buy/Sell signals filtering noise, color-coded trends & strength shield 🛡️. Trade only with POWER ⚡
Indicator
Breakout
Stocks
Signal
Darvas Box
The Darvas Box involves identifying "boxes" or trading ranges where a stock's price consolidates before breaking out.
Parabolic SAR Alert
Parabolic SAR Alert - Trend reversal alerts with smart signals & custom alerts.
Indicator
XAUUSD
Commodities
FVG_tidypips
A Fair Value Gap (FVG) indicator that identifies potential price imbalances, potential reversal and continuation zones
Order Flow Ticks v2.0
Indicator
XAUUSD
Commodities
ATR
+1
[Stellar Strategies] Visual Trend Momentum
Visual Trend Momentum is a MA/ATR/Volume trend tool. Visual signals for strong trends & reversals. Customizable. 📈📉