
Description
3-Bar Reversal
📊 WHAT IS IT?
The 3-Bar Reversal is a technical indicator that identifies specific reversal patterns formed by exactly three consecutive candles. This classic pattern signals potential changes in price direction through a clear visual structure: a trend candle, an exhaustion candle, and a reversal candle.
🎯 WHAT IS IT FOR?
This indicator helps traders to:
- Detect bullish and bearish reversals with 3-candle structure
- Filter false signals through configurable trend confirmation
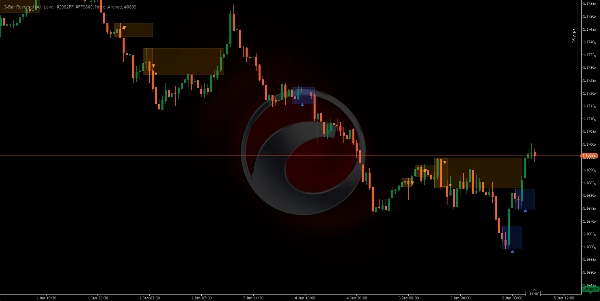
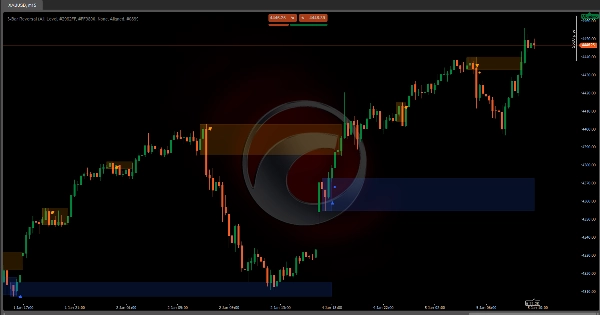
- Identify support and resistance zones based on confirmed patterns
- Visualize trading opportunities with intuitive chart markers
- Trade high-probability reversals on any timeframe
🔍 HOW DOES IT WORK?
Bullish Pattern (3-Bar Bullish Reversal)
Three-candle structure:
- Candle 1 (Bearish): Close below open - confirms selling pressure
- Candle 2 (Exhaustion bearish): Makes new lows AND new highs below candle 1, with bearish close - capitulation signal ⚠️
- Candle 3 (Bullish reversal): Close above open AND high above candle 1's high - confirms control shift ✅
Bearish Pattern (3-Bar Bearish Reversal)
Opposite structure:
- Candle 1 (Bullish): Close above open - confirms buying pressure
- Candle 2 (Extension bullish): Makes new highs AND new lows above candle 1, with bullish close - overextension signal ⚠️
- Candle 3 (Bearish reversal): Close below open AND low below candle 1's low - confirms control shift ✅
Visual Management System (State Machine)
The indicator processes each pattern in three sequential phases:
PHASE 1 - PATTERN DETECTION: 🔍
- The complete 3-candle structure is identified
- A triangle indicator (▲ bullish / ▼ bearish) appears on the third candle
- A semi-transparent setup rectangle is drawn covering:
- Bullish: From candle 1's high to the lowest low (candle 2 or 3)
- Bearish: From candle 1's low to the highest high (candle 2 or 3)
- This rectangle marks the "battle zone" where the reversal occurred
PHASE 2 - CONFIRMATION OR INVALIDATION: ⏳
The system waits for the next candle after the pattern to validate it:
Bullish Confirmation: ✅
- The next candle's close must exceed candle 1's high (rectangle ceiling)
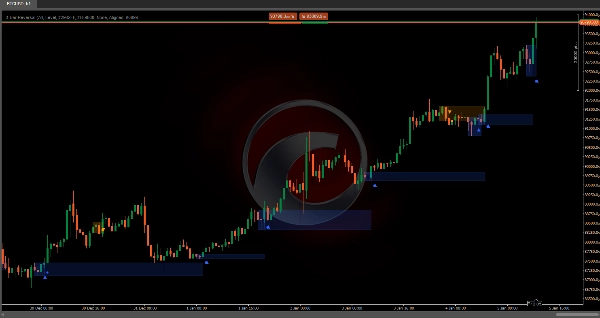
- A solid dot (●) appears marking confirmation
- The rectangle becomes an active support zone
Bearish Confirmation: ✅
- The next candle's close must break candle 1's low (rectangle floor)
- A solid dot (●) appears marking confirmation
- The rectangle becomes an active resistance zone
Invalidation: ❌
- Bullish fails if: close below rectangle minimum OR bearish pattern appears
- Bearish fails if: close above rectangle maximum OR bullish pattern appears
- The rectangle stops extending (pattern dies)
Waiting Extension: ⏸️
- If there's no confirmation or failure, the rectangle extends horizontally candle by candle
PHASE 3 - ACTIVE SUPPORT/RESISTANCE ZONE: 🎯
- Once confirmed, the zone extends indefinitely to the right
- Bullish zone: Remains active while price stays above the floor
- Bearish zone: Remains active while price stays below the ceiling
- The zone deactivates when price completely breaks it in the opposite direction
⚙️ MAIN CONFIGURATION
Pattern Mode
Controls which pattern variations are accepted:
- Normal: Only accepts when candle 3 closes INSIDE candle 1's range
- Bullish: Close < candle 1's high (moderate reversal)
- Bearish: Close > candle 1's low (moderate reversal)
- Enhanced: Only accepts when candle 3 closes OUTSIDE candle 1's range 🔥
- Bullish: Close > candle 1's high (explosive reversal)
- Bearish: Close < candle 1's low (explosive reversal)
- All (Recommended): Accepts both types without distinction ⭐
Support/Resistance Type
- Level: Basic line functionality (limited in this version)
- Zone: Draws shaded rectangles marking SR zones after confirmation 📦
- None: No SR zones, only shows detected patterns
Customizable Colors 🎨
- Bullish Reversal Color: For triangles, rectangles and bullish zones (default:
#2962FF- blue) - Bearish Reversal Color: For triangles, rectangles and bearish zones (default:
#FF9800- orange) - Bullish Trend Color: For trend filter visualization (default:
#089981- green) - Bearish Trend Color: For trend filter visualization (default:
#F23645- red)
🔧 TREND FILTERS
The indicator can filter patterns based on overall trend direction using four methods:
1. Moving Average Cloud ☁️
Uses two moving averages to identify trend:
Parameters:
- Moving Average Type: Simple, Exponential, Hull, Weighted, etc. (default: Hull)
- Fast Period: 50 (default)
- Slow Period: 200 (default)
Filter Logic (Aligned):
- Bullish trend detected when: Price > Fast MA AND Fast MA > Slow MA ✅
- Bearish trend detected when: Price < Fast MA AND Fast MA < Slow MA ✅
- Only shows bullish patterns in bullish trend and bearish patterns in bearish trend
Opposite Logic (Opposite):
- Inverts conditions to capture major counter-trend reversals
2. Supertrend 📈
Volatility-based trend following indicator (ATR):
Parameters:
- ATR Period: 10 (default) - volatility calculation window
- Multiplier Factor: 3.0 (default) - indicator sensitivity
Logic:
- Calculates upper and lower band using ATR
- Price above Supertrend = bullish trend 🟢
- Price below Supertrend = bearish trend 🔴
- Filters patterns according to configured alignment
3. Donchian Channels 📊
Uses price extremes over a period:
Parameters:
- Channel Length: 13 (default)
Logic:
- Upper channel = highest high of N periods
- Lower channel = lowest low of N periods
- Midpoint = (upper + lower) / 2
- Price above midpoint = bullish trend 🟢
- Price below midpoint = bearish trend 🔴
4. None (No Filter) 🔓
Shows ALL detected 3-bar patterns without considering overall trend. Useful for:
- Range-bound markets
- Pure pattern analysis
- Reversal trading in any context
Trend Alignment
Applies when filter is active:
- Aligned: Only shows patterns that go WITH the identified trend ➡️
- Bullish patterns only in bullish trend
- Bearish patterns only in bearish trend
- Opposite: Only shows patterns that go AGAINST the identified trend 🔄
- Bullish patterns in bearish trend (major reversal)
- Bearish patterns in bullish trend (major reversal)
Summary
It operates in three phases: pattern detection, confirmation or invalidation based on the next candle's behavior, and establishing active support or resistance zones that extend while price respects them. The indicator supports configurable pattern modes (Normal, Enhanced, or All) to control acceptance criteria for reversals.
Trend filtering is available through four methods—Moving Average Cloud, Supertrend, Donchian Channels, or no filter—allowing users to align pattern signals with overall market trends or capture counter-trend reversals. Confirmed reversal zones are displayed as shaded rectangles or levels, customizable in color for bullish and bearish signals, trend filters, and zones.
This tool is designed for use on any timeframe and across various markets, including forex pairs (EURUSD, GBPUSD, USDJPY, NZDUSD), commodities (XAUUSD), indices (NAS100), and cryptocurrencies (BTCUSD). It aids traders in detecting high-probability reversals, filtering false signals, and identifying support and resistance zones with clear visual markers.


