
Description
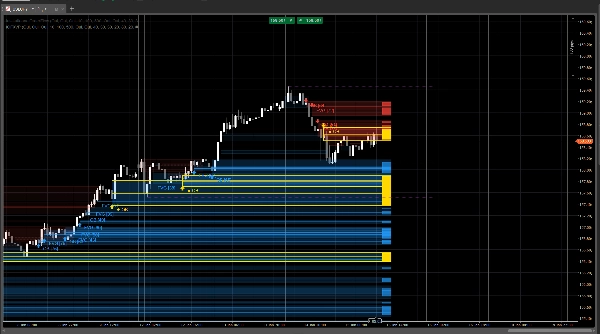
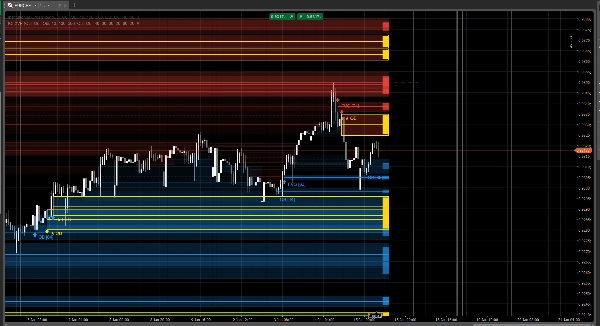
IOF Fusion Zones is a premium market-structure overlay that shows Institutional Order Flow concepts (FVG + Order Blocks + Liquidity) with a micro “volume-profile style” zone visualization.
Instead of drawing generic rectangles, each zone is scored, weighted, and displayed with a POC-style center line and intensity bar, helping you instantly find low-quality noise from high-conviction areas.
This tool is designed for traders who want clean structure + objective zone ranking.
What it detects
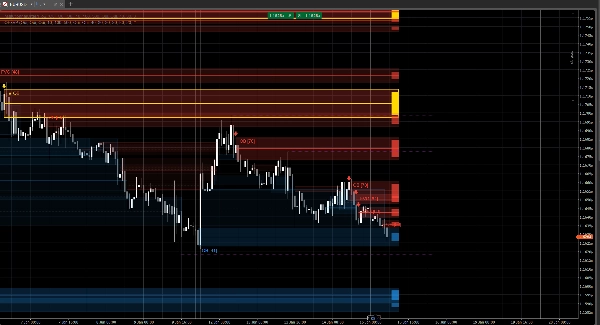
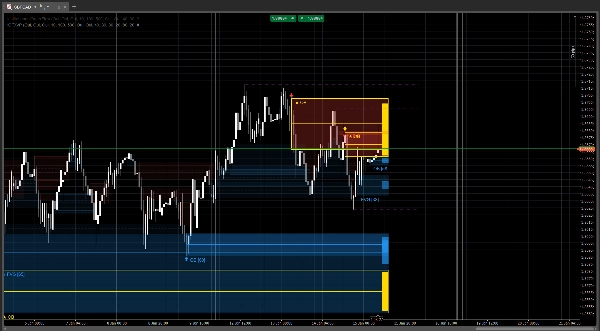
1) Smart IOF Zones
- Fair Value Gaps (FVG) using strict 3-bar gap logic
- Order Blocks (OB) detected from Break of Structure (BOS) logic (last opposite candle before displacement)
- Zones extend forward and remain actionable until mitigation or expiry
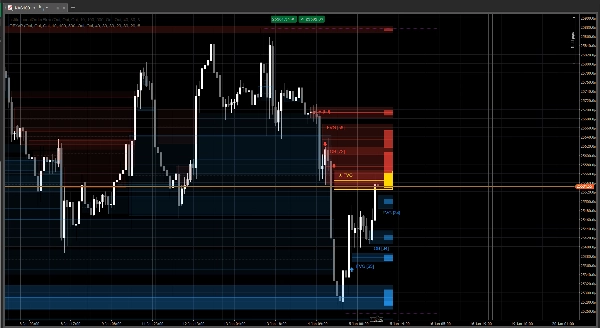
2) Liquidity Levels
- Swing-based liquidity pools (highs/lows) plotted as dotted levels
- Automatically detects sweeps + rejection behavior (sweep + close back through the level)
Alpha Scoring Engine (0–100)
Each zone receives an Alpha Score based on 3 weighted components (fully configurable):
- Volume Z-Score (relative volume strength)
- Displacement vs ATR (move strength / impulse quality)
- Confluence (proximity to other active zones + liquidity levels)
You can set:
- Minimum score to display
- Extreme threshold (zones marked as premium/major)
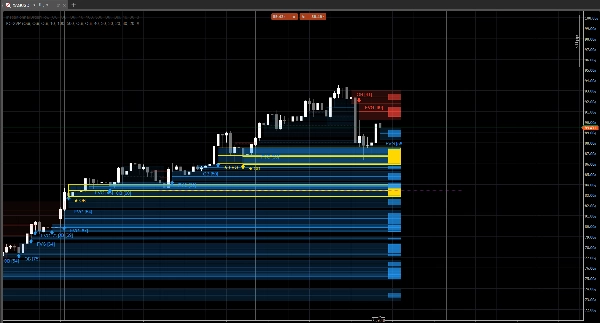
Micro-Profile Visualization (POC + Intensity)
Every valid zone can display:
- POC line (zone midpoint) — acts as a clear “control price” inside the zone
- Intensity bar (volume-profile style) — height and brightness reflect the Alpha Score
- Optional labels, arrows, and extreme borders for instant filtering
This makes zones readable at a glance:
- faint = low importance
- strong fill + bold POC = high-quality zone
- gold accent = extreme / priority level
Mitigation & Retest Logic
- Zones track first retest and can “boost” their Alpha Score after a valid touch
- Mitigated zones can be:
- kept on chart (faded, strikethrough style), or
- fully removed (clean mode)
Historical Scan (fast context)
On first run, the indicator can scan up to 2,000 bars (user-defined) to build immediate context:
- past FVG / OB zones
- liquidity levels
- mitigation state checking
Alerts (optional)
Receive alerts for:
- Extreme zones
- First retest of a valid zone
(Alerts are designed to trigger only on meaningful events to avoid spam.)
Recommended Use
- Identify high-quality reaction zones (OB/FVG) ranked by Alpha Score
- Use liquidity lines to anticipate sweep/rejection behavior
- Focus on Extreme + High Alpha zones where structure + displacement + volume align
- Combine with your own execution model and risk rules
Disclaimer
This indicator is a decision-support tool, not financial advice. Market conditions vary across symbols and sessions. Always backtest and manage risk appropriately.


