
ChoppinessIndex
Indicator
154 downloads
Version 1.0, Mar 2026
Windows, Mac
Since 16/01/2025
3.15M
Traded volume
2.04K
Pips won
399
Free installs
Description
How it works
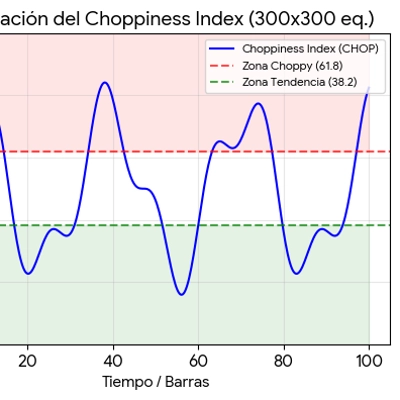
- Period: default 14. The indicator computes the ratio of the sum of high–low ranges over the period to the true range across the same period, then scales the result with a logarithmic formula: choppiness = 100 * log10(sum(Range) / TrueRange) / log10(Period)
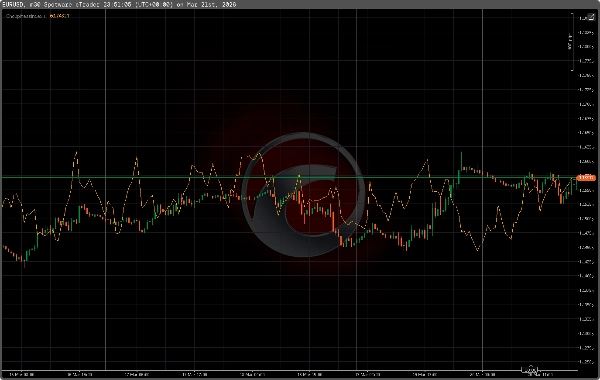
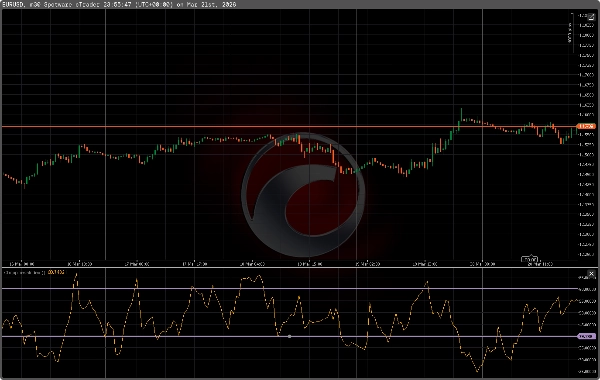
- Output: a single line labelled "CMI" (orange by default) where:
- High values = market is choppy/ranging (avoid directional trades or wait for breakout confirmation)
- Low values = market is trending (look for trend-following opportunities)
Interpretation & typical settings
- Default Period: 14 (tune to 7–28 depending on timeframe and market).
- Common thresholds (suggested, adjustable):
- Above ~61.8 → highly choppy / range-bound
- 38.2–61.8 → mixed / consolidation
- Below ~38.2 → trending market (strong directional movement)
- Timeframes:
- Use higher timeframes (H1, H4, Daily) for trend confirmation and swing trades.
- Use lower timeframes (M5–M30) with a reduced Period for scalping setups.
- Markets: works on Forex, gold/silver (XAUUSD/XAGUSD), indices and cryptocurrencies. Performance depends on the instrument’s volatility profile.
How to use in a strategy
- Breakout filter: only take breakout entries when CMI is below your trending threshold (e.g., <38).
- Trend confirmation: combine with a trend indicator (moving averages, Supertrend) and/or momentum indicators (MACD, RSI) — enter trades when both trend/momentum confirm and CMI indicates a trending environment.
- Avoid signal noise: when CMI is above the choppy threshold (e.g., >61), postpone directional trades or tighten stops.
- Volatility pairing: use ATR or Bollinger Bands to size risk and confirm volatility regimes.
Complementary indicators
- ADX (trend strength), ATR (volatility), MACD / RSI (momentum), Supertrend or moving averages (trend direction), Bollinger Bands (range/volatility).
Installation & parameters
- Parameter: Period (default 14).
- Output name: CMI (orange).
- Non-repainting: values are computed on completed bars; use usual risk management and confirmations.
Risk notice This indicator provides informational signals to support decision-making. It is not a standalone trading system. Backtest and validate settings for your instruments and timeframes. Always use proper risk and money management.
Summary
AI summary
The Choppiness Index (CMI) is a technical indicator designed to distinguish trending markets from ranging (choppy) markets, aiding traders in filtering breakout signals and improving trend-following entries. It calculates the ratio of the sum of high–low price ranges over a specified period (default 14) to the true range, then applies a logarithmic scale to produce a single output line labeled "CMI."
Key functionality includes:
- High CMI values indicate a choppy or range-bound market, suggesting caution with directional trades or waiting for breakout confirmation.
- Low CMI values signal trending markets, highlighting opportunities for trend-following strategies.
- Adjustable period settings (7–28) allow tuning based on timeframe and market conditions.
- Suggested thresholds: above ~61.8 for choppy markets, 38.2–61.8 for consolidation, and below ~38.2 for trending conditions.
- Suitable for multiple markets including Forex, commodities (gold, silver), indices, cryptocurrencies, and stocks.
- Recommended use on higher timeframes (H1, H4, Daily) for trend confirmation and swing trading, and on lower timeframes (M5–M30) with shorter periods for scalping.
- Can be combined with other indicators such as ADX, ATR, MACD, RSI, Supertrend, and Bollinger Bands for enhanced strategy development.
- Non-repainting values are calculated on completed bars to support reliable analysis.
This indicator serves as an informational tool to support trading decisions and should be used alongside proper risk management and complementary indicators.
Key functionality includes:
- High CMI values indicate a choppy or range-bound market, suggesting caution with directional trades or waiting for breakout confirmation.
- Low CMI values signal trending markets, highlighting opportunities for trend-following strategies.
- Adjustable period settings (7–28) allow tuning based on timeframe and market conditions.
- Suggested thresholds: above ~61.8 for choppy markets, 38.2–61.8 for consolidation, and below ~38.2 for trending conditions.
- Suitable for multiple markets including Forex, commodities (gold, silver), indices, cryptocurrencies, and stocks.
- Recommended use on higher timeframes (H1, H4, Daily) for trend confirmation and swing trading, and on lower timeframes (M5–M30) with shorter periods for scalping.
- Can be combined with other indicators such as ADX, ATR, MACD, RSI, Supertrend, and Bollinger Bands for enhanced strategy development.
- Non-repainting values are calculated on completed bars to support reliable analysis.
This indicator serves as an informational tool to support trading decisions and should be used alongside proper risk management and complementary indicators.
Indicator profile
Customer reviews
0.0
Reviews: 0
Customer reviews
No reviews for this product yet. Already tried it? Be the first to tell others!
Discussion
FAQ
Forex
Signal
Breakout
Scalping
Indices
Commodities
Crypto
Stocks
Products available through cTrader Store, including trading bots, indicators and plugins, are provided by third-party developers and made available for informational and technical access purposes only. cTrader Store is not a broker and does not provide investment advice, personal recommendations or any guarantee of future performance.
More from this author


















Price
Since 16/01/2025
3.15M
Traded volume
2.04K
Pips won
399
Free installs