
Scalper Signal MTF
Indicator
252 downloads
Version 1.0, Aug 2025
Windows, Mac
Description
Overview
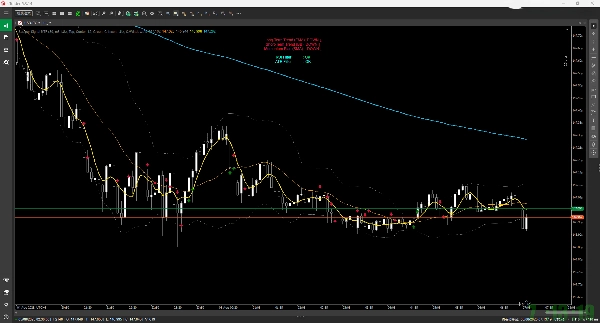
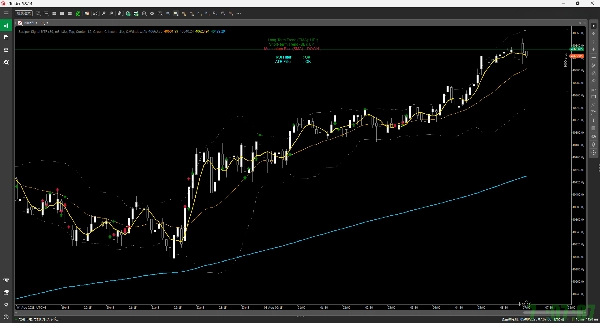
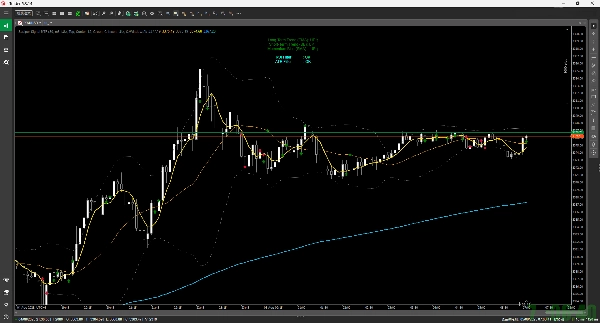
Based on technical indicators from a specified timeframe (e.g., 5-minute), it displays buy/sell signals (arrows) on the current chart. It also simulates trades after a signal appears and plots a mark (a star) at the potential exit point.
Main Features
- Buy/Sell Signal Display:
- Buy Signal (Up Arrow): Based on an SMA (Simple Moving Average) golden cross, combined with conditions from RSI, 200 EMA, and Bollinger Bands to identify favorable buying opportunities.
- Sell Signal (Down Arrow): Based on an SMA dead cross, combined with conditions from RSI, 200 EMA, and Bollinger Bands to identify favorable selling opportunities.
- Trade Simulation:
- After a signal, it assumes a trade is closed if any of the following conditions are met, and marks the chart with a star icon:
- Take Profit / Stop Loss (based on ATR and a specified Risk:Reward ratio).
- Touching the Bollinger Bands (upper/lower bands or the middle line).
- Exceeding the maximum holding time.
- Breakeven and trailing stops are also calculated internally.
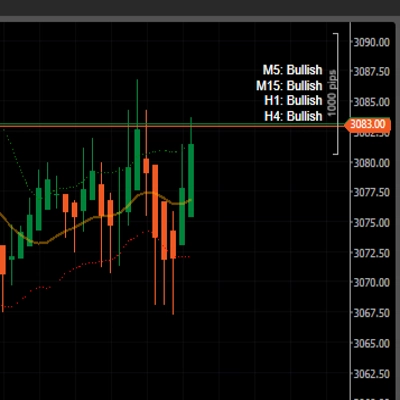
- Dashboard Display:
- Displays a simple summary of the current market environment on the top-left of the chart, including the long-term trend (EMA), short-term trend (BB), and momentum (SMA).
- Alert Function:
- Provides a sound notification when a new signal is generated.
Parameters
You can freely customize the following items in the indicator's settings:
- The timeframe used for calculations (MTF).
- The periods for the various indicators (SMA, RSI, BB, EMA).
- Trade exit rules (e.g., Risk:Reward ratio, max holding time).
- Display settings for signals and the dashboard (visibility, colors, size).
Summary
AI summary
Scalper Signal MTF is a custom indicator designed for the cTrader platform that provides multi-timeframe scalping signals. It analyzes technical indicators from a chosen timeframe—such as 5 minutes—and displays buy (up arrow) and sell (down arrow) signals on the current chart. Buy signals are generated based on an SMA golden cross combined with RSI, 200 EMA, and Bollinger Bands conditions; sell signals use an SMA dead cross with similar criteria.
The indicator simulates trades after signals appear and marks potential exit points with a star icon. Trade exits are triggered by take profit or stop loss levels (calculated using ATR and a specified risk-reward ratio), touching Bollinger Bands, exceeding maximum holding time, or internal breakeven and trailing stop calculations.
A dashboard on the chart’s top-left summarizes the current market environment, showing long-term trend (EMA), short-term trend (Bollinger Bands), and momentum (SMA). The indicator also provides sound alerts when new signals occur.
Users can customize the timeframe for calculations, indicator periods (SMA, RSI, BB, EMA), trade exit rules, and display settings including signal and dashboard visibility, colors, and sizes.
Indicator profile
Customer reviews
0.0
Reviews: 0
Customer reviews
No reviews for this product yet. Already tried it? Be the first to tell others!
Discussion
FAQ
Products available through cTrader Store, including trading bots, indicators and plugins, are provided by third-party developers and made available for informational and technical access purposes only. cTrader Store is not a broker and does not provide investment advice, personal recommendations or any guarantee of future performance.
More from this author


!["[Stellar Strategies] Wave Trend Pro" logo](https://cdn.ctrader.com/image/webp/5f226fbb-245a-41cd-9cdd-b018257d5e6d_28617)

!["[Hamster-Coder] Bollinger Bands" logo](https://cdn.ctrader.com/image/webp/21d8e5d6-fb11-4bac-b9ee-cd05c2b76804_30327)


Price
1
Sales
1.32K
Free installs