
Description
Identify zones of HIGH INSTITUTIONAL INTEREST: Where there is MORE VOLUME in the breaks, there is GREATER PARTICIPATION from LARGE PLAYERS.
• ⚖️ Measure the BALANCE OF POWER: See whether BUYING or SELLING PRESSURE dominates in each price zone
• 🎯 Detect KEY LEVELS: Zones with HIGHER BREAK VOLUME often act as FUTURE SUPPORT/RESISTANCE
• ✅ Confirm movements: A BREAKOUT with HIGH VOLUME has a HIGHER PROBABILITY of being genuine
https://chartshots.spotware.com/c/6941a3f65f376
📈 HOW TO READ IT?
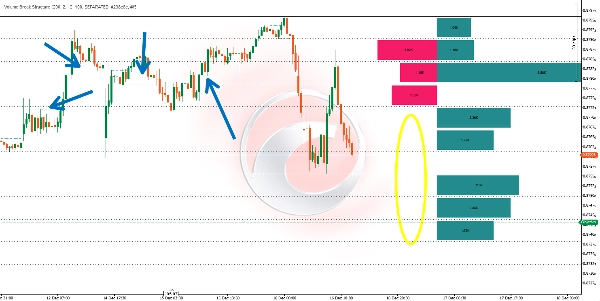
📊 The Horizontal Lines
• Each line marks a level where a STRUCTURE BREAK occurred
• 🟢 BULLISH breaks
• 🔴 BEARISH breaks
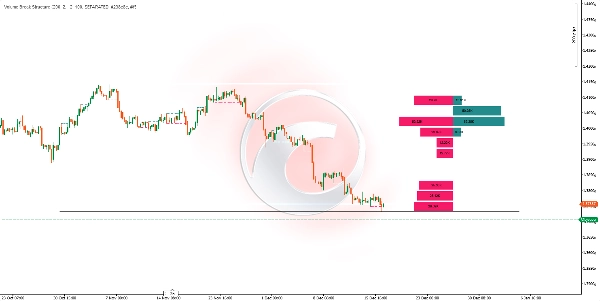
📈 The Histogram
• Located on the RIGHT SIDE OF THE CHART
• Divided into ROWS representing EQUAL PRICE RANGES
• 📗 BUYER PRESSURE bars: ACCUMULATED volume of bullish breaks in that zone
• 📕 SELLER PRESSURE bars: ACCUMULATED volume of bearish breaks in that zone
• ⬆️ Bar size: LARGER size indicates GREATER VOLUME of breaks at that level
https://chartshots.spotware.com/c/6941a4346ede0
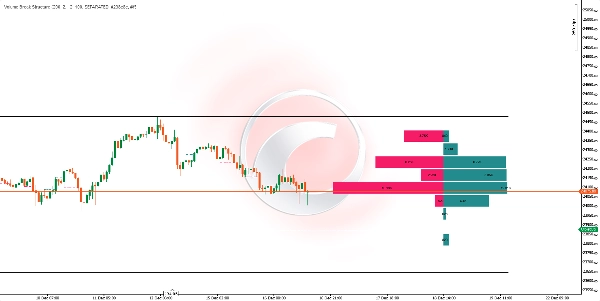
🟦 The Grid
• The SOLID top and bottom lines mark the MAXIMUM and MINIMUM RANGE of the analyzed period
• The DOTTED lines divide that range into EQUAL SECTIONS for easier reading
⚙️ 🔧 MAIN PARAMETERS
ParameterFunction
🕯️ Calculation Bars
Number of candles it analyzes BACKWARDS
🎚️ Swing Length
SENSITIVITY for detecting pivots (HIGHER = fewer signals, MORE RELIABLE)
📊 Histogram Rows
Number of DIVISIONS/ROWS in the histogram
📏 Histogram Width
VISUAL WIDTH of the histogram
👁️ Display Mode
SEPARATED (buy/sell) or AGGREGATED (total volume)
🔄 WHEN DOES IT UPDATE?
🕒 The indicator AUTOMATICALLY RECALCULATES at the CLOSE of each candle, incorporating any NEW STRUCTURE BREAK that has occurred.
💡 🤝 HOW TO COMBINE IT?
📈 With TREND ANALYSIS
• In an UPTREND, look for zones where BUYING PRESSURE VOLUME DOMINATES for potential entries on PULLBACKS
• In a DOWNTREND, look for zones where SELLING PRESSURE VOLUME DOMINATES for potential entries on BOUNCES
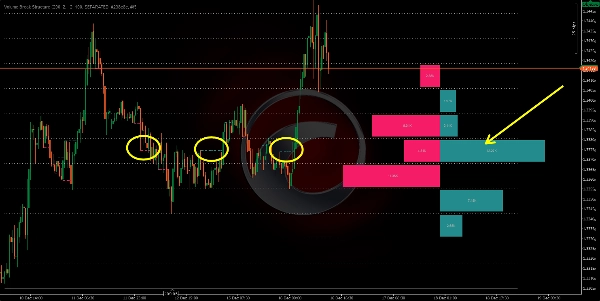
🛡️ With SUPPORT and RESISTANCE
• Levels with the HIGHEST BREAK VOLUME often become FUTURE REACTION ZONES
• Use the histogram to identify the zones most "DEFENDED" by buyers or sellers
🌊 With ORDER FLOW
• CONFIRM histogram readings with REAL-TIME ORDER FLOW tools
• High break volume zones often coincide with AREAS OF INSTITUTIONAL ABSORPTION
🕯️ With PRICE ACTION
• Look for CANDLESTICK PATTERNS in zones where the histogram shows SIGNIFICANT IMBALANCE
• A REVERSAL PATTERN in a zone of HIGH BUYING PRESSURE has a HIGHER PROBABILITY OF SUCCESS
🎯 🚀 QUICK INTERPRETATION
Visual SignalInterpretation
📗 Large BUYER bar, 📕 small seller bar
STRONG DEMAND ZONE, possible SUPPORT
📕 Large SELLER bar, 📗 small buyer bar
STRONG SUPPLY ZONE, possible RESISTANCE
⚔️ Both bars LARGE and similar
BATTLE ZONE, HIGH VOLATILITY expected
⏭️ Row with NO BARS
ZONE OF LITTLE INTEREST, price passed through QUICKLY
IMPORTANT CONSIDERATIONS
• ❌ The indicator WORKS WITH CONFIRMED HISTORICAL DATA; IT DOES NOT PREDICT THE FUTURE
• 📊 HIGHER number of calculation bars = BROADER VIEW but can DILUTE RECENT SIGNALS
• ⏰ ADJUST the Swing Length according to the TIMEFRAME: HIGHER VALUES for HIGHER TIMEFRAMES
• 🛡️ ALWAYS COMBINE with PROPER RISK MANAGEMENT
Summary
Key features include:
- Horizontal lines marking bullish (green) and bearish (red) structure breaks.
- A histogram on the right side of the chart divided into rows representing equal price ranges, showing accumulated volume of bullish and bearish breaks. Larger bars indicate higher volume.
- A grid marking the maximum and minimum price range of the analyzed period, divided into equal sections for easier reading.
The indicator recalculates automatically at the close of each candle, updating with any new structure breaks. Main adjustable parameters include the number of bars analyzed backward, swing length sensitivity for pivot detection, histogram rows, histogram width, and display mode (separated buy/sell or aggregated volume).
Volume Break Structure can be combined with trend analysis, support and resistance levels, order flow tools, and price action patterns to confirm market movements and identify potential entry points. It works with confirmed historical data and does not predict future price action.
Customer reviews
5 | 0 % | |
4 | 100 % | |
3 | 0 % | |
2 | 0 % | |
1 | 0 % |


