
ScalperSignalVisual
Indicator
191 downloads
Version 1.0, Aug 2025
Windows, Mac
Description
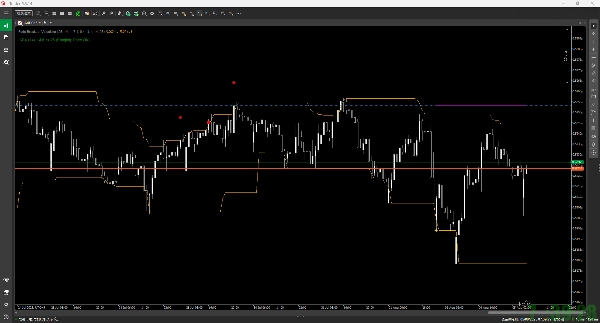
This indicator is a tool to visualize the trading logic of a contrarian strategy called "Fade Breakout" on your chart. It does not perform actual trades but shows how a position would be managed from entry to exit when a signal occurs.
Key Features
- Entry Signals:
- It utilizes the Donchian Channel.
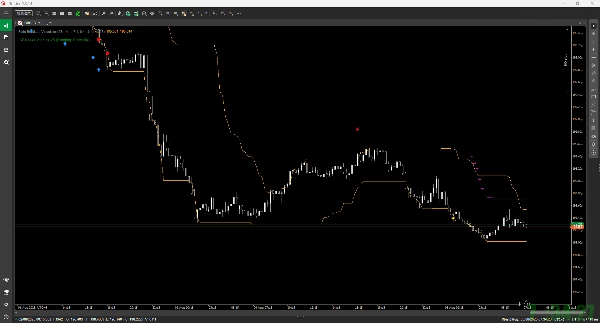
- Buy Signal (Contrarian): When the price breaks down below the lower Donchian Channel band, it displays a buy signal (blue up arrow ↑).
- Sell Signal (Contrarian): When the price breaks out above the upper Donchian Channel band, it displays a sell signal (red down arrow ↓).
- Risk Management:
- Upon entry, an initial Stop Loss (red dotted line) and a first Take Profit (green dotted line) are drawn, based on the ATR (Average True Range).
- When the first Take Profit (TP1) is hit, a gold star (★) appears, and the stop loss is moved to the entry price (break-even).
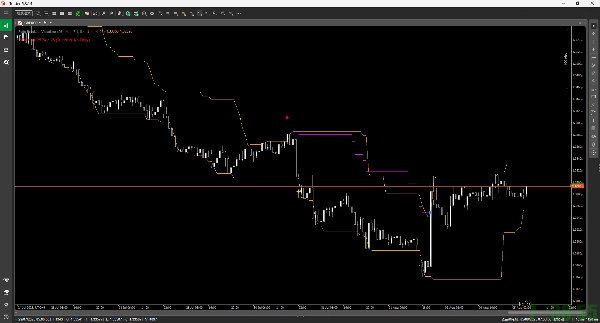
- After that, an ATR-based Trailing Stop activates to secure profits by following the price. The trailing stop's path is displayed as a magenta line.
- Trade Exits:
- Stop Loss: If the price hits the stop-loss level, it is marked with a red square (■).
- Trailing Stop Exit: If the price hits the trailing stop, it is marked with a blue square (■).
- ADX Filter:
- You can optionally enable the ADX filter.
- If the ADX is higher than a specified value (indicating a strong trend), it will disable new entry signals. The current status (Entry OK / No Entry) is shown in the text at the top-left of the chart.
Summary
Indicator profile
Customer reviews
0.0
Reviews: 0
Customer reviews
No reviews for this product yet. Already tried it? Be the first to tell others!
Discussion
FAQ
Products available through cTrader Store, including trading bots, indicators and plugins, are provided by third-party developers and made available for informational and technical access purposes only. cTrader Store is not a broker and does not provide investment advice, personal recommendations or any guarantee of future performance.
More from this author


Price
1
Sales
1.32K
Free installs