Description
What is a Fair Value Gap?
A Fair Value Gap (FVG) is a powerful price action concept used by institutional traders and Smart Money enthusiasts. It represents an imbalance or inefficiency in the market where price moved so quickly that it left a "gap" - an area with minimal trading activity. These gaps often act as strong support/resistance zones and frequently get "filled" as price returns to seek liquidity.
This indicator automatically detects, tracks, and visualizes these high-probability trading zones on your charts.
Key Features
🎯 Automatic FVG Detection
- Bullish FVGs: Automatically identifies upward price gaps that often act as support zones
- Bearish FVGs: Detects downward price gaps that frequently serve as resistance
- Real-time Updates: Continuously scans price action as new bars form
- Minimum Gap Filter: Customizable filter to ignore insignificant gaps (set in pips)
📊 Visual Excellence
- Color-Coded Zones: Distinct colors for bullish (green) and bearish (red) gaps
- Transparency Levels: Adjustable opacity for filled vs unfilled gaps
- Clean Labels: Clear identification of each FVG type directly on chart
- Professional Design: Non-intrusive visualization that enhances chart clarity
🎪 Entry Zone Highlighting
- Optimal Entry Areas: Automatically marks the best 50% of each FVG for entries
- Buy/Sell Zones: Clearly labeled zones showing where to look for trades
- Smart Positioning: Entry zones positioned for maximum probability setups
- Toggle On/Off: Disable entry zones if you prefer minimal chart display
⚡ Fill Tracking
- Automatic Detection: Tracks when price fills (returns to) each gap
- Visual Feedback: Filled gaps become more transparent to reduce clutter
- Historical Record: Maintains history of filled gaps for analysis
- Status Labels: Shows "Filled" tag on completed gaps
🎛️ Extensive Customization
Display Options
- Recent FVGs Only: Option to show only the most recent gaps (reduces chart clutter)
- Configurable Periods: Set how many recent bars to display gaps for
- Zone Extension: Control how far zones project into the future
- Font Size: Adjustable label text size (6-20)
Visual Customization
- Custom Colors: Choose any color for bullish and bearish FVGs
- Opacity Control: Set transparency from 1-100%
- Entry Zone Display: Toggle entry zones on/off
- Merge Overlapping: Option to combine overlapping zones
Performance Tuning
- Cleanup Interval: Configure memory management frequency
- Minimum Gap Size: Filter gaps by pip size
- Smart Rendering: Only redraws when zones change (optimized performance)
Trading Applications
1. Support & Resistance Trading
- Use bullish FVGs as support levels for long entries
- Use bearish FVGs as resistance levels for short entries
- Wait for price to return to FVG zones before entering trades
2. Trend Trading
- In uptrends, buy when price pulls back to bullish FVGs
- In downtrends, sell when price rallies to bearish FVGs
- Use FVGs as continuation entry points
3. Liquidity Grabs
- Identify where market makers may return to fill orders
- Trade the "fill" of significant FVGs
- Combine with order blocks for high-probability setups
4. Multi-Timeframe Analysis
- Identify FVGs on higher timeframes (H4, D1)
- Enter trades on lower timeframes when price reaches HTF FVGs
- Stack multiple timeframe FVGs for strongest zones
5. Risk Management
- Use FVG boundaries for stop loss placement
- Target opposite FVGs for take profit levels
- Size positions based on FVG zone width
Technical Specifications
Performance
- Optimized Algorithm: Each bar processed only once (10-20x faster than typical indicators)
- Incremental Drawing: Only redraws changed zones (95% fewer draw operations)
- Memory Efficient: Automatic cleanup of old zones
- Scalable: Works efficiently on any timeframe and instrument
Compatibility
- Timeframes: All timeframes supported (M1 to MN)
- Instruments: Works on Forex, Indices, Commodities, Cryptocurrencies, Stocks
- cTrader Version: Compatible with cTrader 4.x and above
- No Dependencies: Standalone indicator, no external libraries required
Detection Logic
- 3-Bar Pattern: Analyzes three consecutive bars for gap formation
- Validated Zones: Ensures all detected gaps have valid top/bottom boundaries
- Duplicate Prevention: HashSet-based system prevents redundant detections
- Error Handling: Comprehensive try-catch blocks ensure stability
Parameter Guide
ParameterDefaultDescription
Minimum Gap Size (Pips)
2
Filters out gaps smaller than this value
Bullish FVG Color
LimeGreen
Color for upward gaps
Bearish FVG Color
Red
Color for downward gaps
Opacity
20
Transparency level (1-100)
Show Entry Zones
True
Display optimal entry areas
Zone Extension (Bars)
50
How far zones project forward
Highlight Recent FVGs Only
True
Show only recent gaps
Recent Periods
20
Number of recent bars to display
Font Size
8
Size of zone labels
Cleanup Interval
100
Memory management frequency
Merge Overlapping Zones
False
Combine overlapping gaps
Usage Tips
Getting Started
- Add to Chart: Drag indicator onto any chart
- Set Minimum Gap: Adjust based on instrument volatility
- Forex majors: 2-5 pips
- Indices: 5-10 pips
- Crypto: 10-20 pips
- Customize Colors: Match your chart theme
- Enable Entry Zones: Turn on for trade planning
Best Practices
- Combine with Trend: Trade FVGs in direction of larger trend
- Wait for Confluence: Use with support/resistance or moving averages
- Respect the Zone: Don't chase price, wait for it to return to FVG
- Higher Timeframes First: Check HTF FVGs before entering on LTF
- Journal Results: Track which FVG setups work best for you
Timeframe Recommendations
- Scalping (M1-M5): Use Recent Periods = 10-15
- Day Trading (M15-H1): Use Recent Periods = 20-30
- Swing Trading (H4-D1): Use Recent Periods = 30-50
- Position Trading (W1-MN): Show all FVGs (Recent Only = False)
Instrument-Specific Settings
Forex Pairs:
- Min Gap Size: 2-5 pips
- Zone Extension: 50 bars
- Works best on majors (EUR/USD, GBP/USD)
Stock Indices:
- Min Gap Size: 5-10 pips
- Zone Extension: 30-50 bars
- Excellent on US30, SPX500, NAS100
Cryptocurrencies:
- Min Gap Size: 10-20 pips
- Zone Extension: 40-60 bars
- High volatility creates many FVGs
Commodities:
- Min Gap Size: 5-10 pips
- Zone Extension: 50 bars
- Works well on XAUUSD (Gold)
What Makes This Indicator Unique?
✅ Accurate Detection Algorithm
Unlike many FVG indicators that use incorrect logic, this indicator uses the proper 3-bar pattern:
- Bullish FVG: Gap between bar 1's high and bar 3's low
- Bearish FVG: Gap between bar 1's low and bar 3's high
- Validated zones with top > bottom guarantee
✅ Performance Optimized
Built from the ground up for speed:
- No redundant calculations
- Incremental drawing system
- Smart memory management
- Handles thousands of bars efficiently
✅ Professional Quality
- Clean, readable code
- Comprehensive error handling
- Detailed logging for debugging
- Regular updates and support
✅ Trader-Focused Features
- Entry zones show where to trade
- Fill tracking reduces confusion
- Customizable for any strategy
- Works on all instruments/timeframes
Common Questions
Q: How many FVGs will appear on my chart? A: Depends on timeframe and volatility. Typically 5-15 active zones. Use "Highlight Recent Only" to control display.
Q: Why do some FVGs disappear? A: When zones are filled or exceed the cleanup period, they're removed to reduce clutter. Adjust "Recent Periods" to keep them longer.
Q: Can I use this for automated trading? A: This is an indicator for visual analysis. For automated trading, you'd need to build a cBot that reads the FVG data.
Q: Does it repaint? A: No. Once a bar closes and an FVG is detected, it remains fixed. Only the current forming bar's potential FVG may change before close.
Q: What's the best timeframe? A: H1 and H4 work well for most traders. Higher timeframes (D1, W1) show stronger, more significant FVGs.
Q: How do I know which FVGs to trade? A: Focus on FVGs that align with the larger trend, are closest to current price, and have confluence with other technical factors.
Support & Updates
- Documentation: Comprehensive user guide included
- Regular Updates: Continuous improvement and optimization
- Bug Fixes: Prompt response to any issues
- Feature Requests: Open to user suggestions
Educational Resources
Recommended Learning
- Study ICT (Inner Circle Trader) concepts
- Learn Smart Money Concepts (SMC)
- Understand market structure and liquidity
- Practice identifying FVGs manually first
Practice Approach
- Visual Training: Spot FVGs manually before using indicator
- Backtest: Review historical FVGs and their fill rates
- Demo Test: Practice trading FVG setups risk-free
- Keep Records: Journal which setups work for your strategy
Installation
- Download
FairValueGapIndicator.csfile - Open cTrader
- Go to Automate → Indicators
- Click "+" to add new indicator
- Select the downloaded file
- Click "Build"
- Drag indicator onto chart
Disclaimer
This indicator is a tool for technical analysis and does not guarantee profitable trades. All trading involves risk. Past performance of identified FVGs does not guarantee future results. Always use proper risk management, maintain appropriate position sizing, and never risk more than you can afford to lose. This tool should be part of a comprehensive trading strategy, not used in isolation.
Version Information
Current Version: 2.0 Last Updated: December 2024 Compatibility: cTrader 4.x+ License: Free for personal use
Tags
Fair Value Gap, FVG, Smart Money, ICT, Order Flow, Support Resistance, Price Action, Liquidity, Imbalance, Trading Zones, Market Structure, Institutional Trading, Supply Demand, Entry Signals
Screenshots Recommended
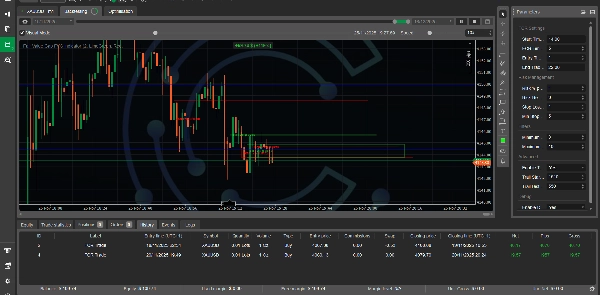
- Main Chart View: Show multiple FVGs with entry zones
- Bullish FVG Example: Clear uptrend with FVG support
- Bearish FVG Example: Downtrend with FVG resistance
- Fill Detection: Show before/after of filled FVG
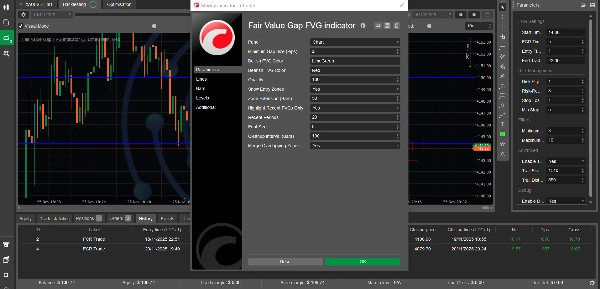
- Parameter Panel: Display customization options
- Multi-Timeframe: Same instrument on different timeframes
Change Log
Version 2.0 (December 2024)
- ✅ Fixed critical FVG detection algorithm
- ✅ Implemented performance optimizations (10-20x faster)
- ✅ Added incremental drawing system (95% fewer redraws)
- ✅ Enhanced error handling and stability
- ✅ Added merge overlapping zones option
- ✅ Improved logging and debugging
- ✅ Optimized memory management
- ✅ Added comprehensive validation
Version 1.0 (Initial Release)
- Basic FVG detection
- Color-coded zones
- Entry zone highlighting
- Fill tracking
Summary
Designed for use on all timeframes and instruments—including Forex, indices, commodities, cryptocurrencies, and stocks—it supports multi-timeframe analysis and offers extensive customization of display options such as gap size filters, zone extension, colors, opacity, and label fonts. Performance optimizations ensure efficient operation with minimal redraws and memory use.
Traders can apply the indicator for support/resistance trading, trend continuation entries, liquidity grabs, and risk management by using FVG boundaries for stop loss and take profit placement. The tool is compatible with cTrader 4.x and above and functions as a standalone indicator without external dependencies. It does not repaint and maintains a historical record of gaps for analysis.
Customer reviews
5 | 50 % | |
4 | 50 % | |
3 | 0 % | |
2 | 0 % | |
1 | 0 % |