
Description
ZigZag Indicator
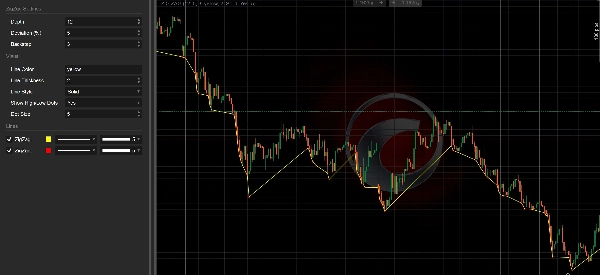
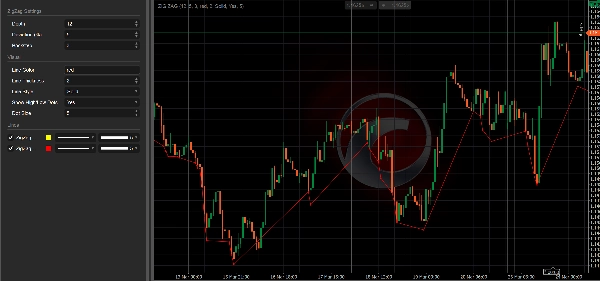
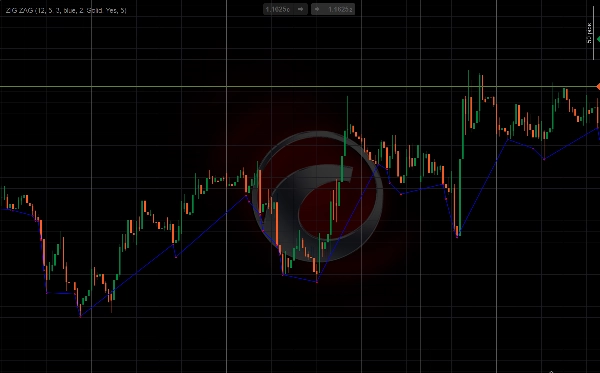
This Customizable ZigZag indicator filters out minor price noise and connects only the most significant swing highs and lows with a series of lines, giving traders a clean visual map of market structure and key turning points.
It works by scanning a rolling window of bars (Depth) to identify meaningful pivots, only confirming a swing when the move from the previous opposite point exceeds a minimum Deviation percentage. The Backstep setting ensures two pivots of the same type aren't registered too close together, keeping the output clean and relevant.
Visually, the connecting lines reveal trend structure at a glance — rising lines indicate higher highs and higher lows; falling lines indicate lower highs and lower lows. Optional dots mark each confirmed pivot precisely, useful as support, resistance, and pattern reference points.
Key parameters — Depth, Deviation, and Backstep — control how sensitive the indicator is. Higher values produce fewer, larger swings suited to higher timeframe analysis; lower values capture more frequent pivots for shorter-term work. Line colour, thickness, and style are fully customizable.
Traders can use this indicator for: trend structure analysis, support and resistance mapping, chart pattern recognition (double tops/bottoms, head and shoulders), and anchoring Fibonacci retracements to confirmed swing points.
It can be used on any trading pair.
Summary
Visually, the indicator connects these pivots with lines that reveal market trend structure: rising lines indicate higher highs and lows, while falling lines show lower highs and lows. Optional dots mark confirmed pivots, which can serve as reference points for support, resistance, and chart pattern recognition.
Key adjustable settings—Depth, Deviation, and Backstep—allow users to tailor sensitivity for different timeframes, from capturing large swings on higher timeframes to more frequent pivots on shorter-term charts. Line color, thickness, and style are fully customizable.
Traders use the Zig Zag indicator for analyzing trend structure, mapping support and resistance levels, identifying classical chart patterns such as head and shoulders, double tops/bottoms, and anchoring Fibonacci retracements to confirmed swing points. It is applicable to any trading pair and supports visualization and signal outputs for breakout and reversal events based on bar data.
Customer reviews
5 | 40 % | |
4 | 60 % | |
3 | 0 % | |
2 | 0 % | |
1 | 0 % |