
Description
Price Projection Dynamic 📈🔮
https://chartshots.spotware.com/c/69d5304ea1cc1
What Is It?
https://chartshots.spotware.com/c/69d52fb4b01cd
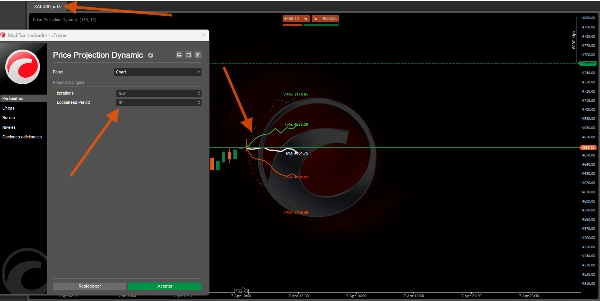
Price Projection Dynamic is an overlay indicator that projects statistically probable future price paths using Monte Carlo simulation and evaluates directional bias through a Bayesian probability classifier. It answers one question: given how this asset has been moving, where is it statistically likely to go next? 📊
https://chartshots.spotware.com/c/69d53010d38ce
How It Works ⚙️
Engine 1 — Monte Carlo Projection 🎲
The indicator analyzes recent price history and extracts logarithmic returns. It calculates the average return and its standard deviation — capturing both the asset's drift (tendency) and volatility (erratic movement) 🌪️.
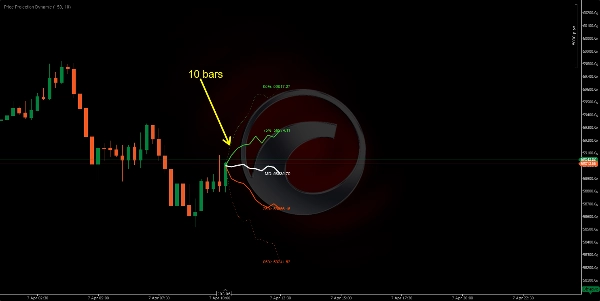
It runs 200 simulated price paths (up to 500) into the future. Each simulation is a "random walk" based on real recent action. From these, the indicator extracts 5 percentile bands:
Band
Meaning
95%
Optimistic extreme — only 5% of simulations went higher 🚀
75%
Upper probable range — price ended above this in 25% of sims 📈
50% (MD)
Median projection — the statistical center of all outcomes 🎯
25%
Lower probable range — price ended below this in 25% of sims 📉
05%
Pessimistic extreme — only 5% of simulations went lower 📉🛑
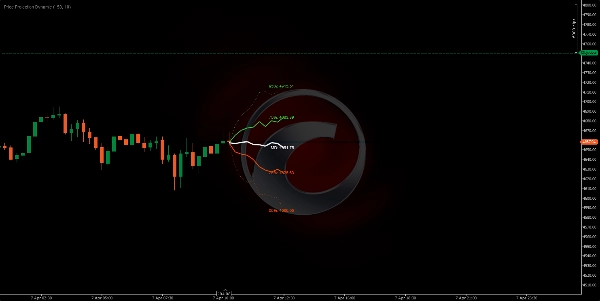
Pro Tip: The wider the fan opens, the higher the current volatility 📢. A tight fan means the asset is moving predictably 🧵.
Engine 2 — Bayesian Classifier 🧠
Independent from the projection, this engine classifies the market as bullish or bearish by:
- Looking back over a window (default 500 bars) 🔍.
- Measuring relative volume and momentum for bullish vs. bearish bars.
- Calculating which profile the current bar fits better using Gaussian probability ⚖️.
The result is a win probability percentage:
Probability
Interpretation
> 70%
High bullish confidence ✅🟢
50–70%
Moderate / unclear ⚖️🟡
< 30%
High bearish confidence ✅🔴
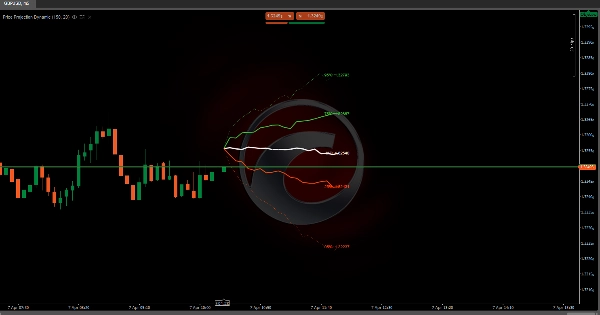
Visual Elements 🎨
- Green lines (75%, 95%): Upper projection bands — bullish range 🍏
- White line (MD): Median projected price — most probable path 🏁
- Orange lines (25%, 05%): Lower projection bands — bearish range 🍊
- Dotted outer lines: 95% and 05% extremes (low probability boundaries) ⚠️
- Solid inner lines: 75%, 50%, 25% (high probability zone) ✅
- Price labels: Exact projected price for each percentile 🏷️
- Info panel (top-right): Bayesian win probability, median target, relative volume, signal direction 🖥️
How To Use 📖
- Read the fan shape 📢 — If it expands rapidly, volatility is high and projections are less certain.
- Use the median (MD) line 🎯 as the most statistically probable future price target.
- Use 75%/25% bands 📏 as realistic upper/lower targets for trades.
- Use 95%/05% bands 🛑 as extreme boundaries — useful for stop loss placement.
- Check the Bayesian panel 🧠 — A probability above 70% or below 30% adds directional conviction.
- Combine both engines 🤝 — If the median line slopes upward AND Bayesian probability is > 70%, the setup is statistically strong.
Key Parameters ⚙️
Parameter
What It Controls
Higher Value
Lower Value
Iterations
Number of simulated paths
Smoother bands 🌊
Faster computation ⚡
Lookahead
Future projection distance
Longer horizon 🔭
Shorter, more reliable 🔍
Sample Depth
Recent bars to analyze
Long-term behavior 🐢
Recent behavior only 🐇
Classifier Window
Bayesian history
Stabler probability ⚖️
More reactive ⚡
Indicator Profile 📋
- Indicator category: Statistics 📊
- Output type: Visualisation & Signals 🖼️
- Data requirements: Bars only 📶
Disclaimer ⚠️
This indicator projects statistical probabilities, not predictions 🔮. Monte Carlo simulations assume the future will look like the recent past — this breaks during black swan events 🦢 or news-driven gaps. Use as a probabilistic framework alongside your own risk management 🛡️.
Summary
Separately, the Bayesian classifier evaluates market sentiment by analyzing relative volume and momentum over a configurable window, providing a win probability percentage that indicates bullish or bearish confidence. Visual elements include color-coded projection bands (green for bullish, orange for bearish), a median price line, price labels for each percentile, and an info panel displaying Bayesian probability and other metrics.
Key adjustable parameters include the number of simulation iterations, projection horizon, sample depth of historical bars, and classifier window size. The indicator requires bar data with volume and outputs visual projections and directional signals. It is designed to offer a probabilistic framework for anticipating price movement based on recent market behavior, suitable for various symbols including BTCUSD, EURUSD, GBPUSD, XAUUSD, NAS100, and others.
Customer reviews
5 | 0 % | |
4 | 100 % | |
3 | 0 % | |
2 | 0 % | |
1 | 0 % |


!["[Stellar Strategies] Inside Bar with Signals" logo](https://cdn.ctrader.com/image/webp/1d9e8bfa-3b2c-4440-bb37-5856902008a7_30683)


