![Trading product for [Stellar Strategies] Moving Averages Combined 1.0 Indicator Signal RSI, image 1](https://cdn.ctrader.com/image/webp/93692c9d-ac16-4dd8-ba83-5a62250c39a9_27250)
[Stellar Strategies] Moving Averages Combined 1.0
Indicator
245 downloads
Version 1.0, Mar 2025
Windows, Mac
5.0
Reviews: 1
![Trading product for [Stellar Strategies] Moving Averages Combined 1.0 Indicator Signal RSI, image 2](https://cdn.ctrader.com/image/webp/af42e1a3-f168-4456-81b0-72db1b69cc8e_27251)
![Trading product for [Stellar Strategies] Moving Averages Combined 1.0 Indicator Signal RSI, image 3](https://cdn.ctrader.com/image/webp/138fc3d1-bbf1-4f7c-9023-dad58a4a1503_27252)
Description
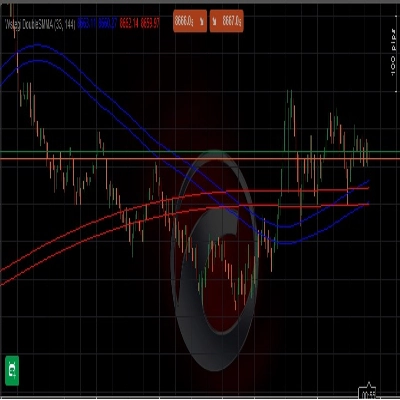
The "Combined Moving Averages" indicator for cTrader provides a smoothed representation of price action by averaging six different moving averages: three Simple Moving Averages (SMA) and three Exponential Moving Averages (EMA). This combined average aims to reduce noise and provide a clearer, more reliable trend signal compared to using individual moving averages.
Key Features:
- Combined Analysis: Averages six moving averages (3 SMA, 3 EMA) for a comprehensive view.
- Customizable Periods: Allows users to adjust the periods for short, medium, and long-term SMAs and EMAs.
- Smoothed Trend: Provides a smoother line than individual moving averages, reducing whipsaws and false signals.
- Overlay Indicator: Plots directly on the price chart for easy visualization.
- Uses Close Prices: all calculations are based on the close prices of the bars.
Parameters:
- SMA Short Period: Period for the short-term Simple Moving Average (default: 9).
- SMA Medium Period: Period for the medium-term Simple Moving Average (default: 34).
- SMA Long Period: Period for the long-term Simple Moving Average (default: 100).
- EMA Short Period: Period for the short-term Exponential Moving Average (default: 20).
- EMA Medium Period: Period for the medium-term Exponential Moving Average (default: 34).
- EMA Long Period: Period for the long-term Exponential Moving Average (default: 100).
Output:
- MA Combined: The resulting combined moving average line, displayed in bright green (#01FE53) with a thickness of 3.
How to Use:
- Download and Install:
- Download the cAlgo indicator file (.algo).
- Open cTrader and navigate to "Automate" -> "Indicators."
- Click "Add" and select the downloaded indicator file.
- Build the indicator.
- Add to Chart:
- Right-click on the chart and select "Indicators."
- Find "Combined Moving Averages" in the list and click "Add."
- Adjust the parameters as desired and click "OK."
- Interpretation:
- Trend Following: Use the combined moving average to identify the overall trend.
- When the price is above the combined moving average, it suggests an uptrend.
- When the price is below the combined moving average, it suggests a downtrend.
- Crossovers: While this indicator is designed to be smoother than single MAs, crossovers of price and the combined MA can also be used as entry signals.
- Smoothing: The primary objective is to use this indicator as a way to smooth out price action, and to use the direction of the line as a trend filter.
- Parameter Adjustments:
- Experiment with different period settings to find what works best for your trading style and the specific market you are trading.
- Shorter periods will make the indicator more sensitive to price changes, while longer periods will provide a smoother, more long-term view.
- Combine with Other Indicators:
- Use the combined moving average in conjunction with other indicators (e.g., RSI, MACD) for confirmation signals.
- This indicator works well as a trend filter for other entry signals.
Important Notes:
- Moving averages are lagging indicators, meaning they reflect past price action.
- The effectiveness of the indicator depends on the chosen parameters and market conditions.
- Always use proper risk management when trading.
- This indicator is designed to provide a smoothed average of multiple moving averages, and is not a guarantee of future price movements.
.............................................................................................................................................................................................................
Trader Warning: Trading involves significant risk and is not suitable for every investor. You may lose some or all of your invested capital. Always ensure you fully understand the risks and seek independent financial advice if necessary. The Combined Moving Averages indicator is a tool that averages multiple moving averages to provide a smoothed trend representation, but it does not guarantee profitable trades. Moving averages are lagging indicators, reflecting past price action, and their effectiveness depends on chosen parameters and market conditions. Do not rely solely on this indicator for trading decisions. Use it in conjunction with other analysis methods and proper risk management. Past performance is not indicative of future results.
Summary
AI summary
The "[Stellar Strategies] Moving Averages Combined 1.0" indicator for cTrader calculates a smoothed price trend by averaging six moving averages: three Simple Moving Averages (SMA) and three Exponential Moving Averages (EMA). This combined moving average reduces market noise and provides a clearer trend signal than individual moving averages.
Key features include:
- Combined analysis of 3 SMAs and 3 EMAs for a comprehensive trend view.
- Customizable periods for short, medium, and long-term SMAs and EMAs.
- A smoother trend line that reduces whipsaws and false signals.
- Overlay plotting directly on the price chart using close prices.
- The combined moving average line is displayed in bright green with adjustable thickness.
Users can adjust parameters to tailor sensitivity and smoothing to their trading style and market conditions. The indicator helps identify trends: prices above the combined average suggest an uptrend, while prices below indicate a downtrend. Crossovers of price and the combined average can serve as entry signals. It is recommended to use this indicator alongside others (e.g., RSI, MACD) for confirmation and as a trend filter.
This tool reflects past price action as a lagging indicator and should be used with proper risk management and additional analysis methods.
Indicator profile
Customer reviews
5.0
Reviews: 1
5 | 100 % | |
4 | 0 % | |
3 | 0 % | |
2 | 0 % | |
1 | 0 % |
Customer reviews
August 18, 2025
Multiple MA types in one indicator, customizable, lightweight. Cons: No alerts, no quick settings panel, no MTF dashboard.
Discussion
FAQ
Signal
RSI
MACD
Products available through cTrader Store, including trading bots, indicators and plugins, are provided by third-party developers and made available for informational and technical access purposes only. cTrader Store is not a broker and does not provide investment advice, personal recommendations or any guarantee of future performance.
More from this author
!["[Stellar Strategies] Market Structure Breakout" logo](https://cdn.ctrader.com/image/webp/bceec265-3247-4b11-915f-6295a29c106d_28465)
!["[Stellar Strategies] Market Session Ultimate" logo](https://cdn.ctrader.com/image/webp/61ffd537-0125-4246-9e72-42eca1791d64_28232)
!["[Stellar Strategies] BOS Trend 1.0" logo](https://cdn.ctrader.com/image/webp/6cdec0f1-0e97-4a82-a8a4-2b67aed54d38_25695)
!["[Stellar Strategies] Inside Bar with Signals" logo](https://cdn.ctrader.com/image/webp/1d9e8bfa-3b2c-4440-bb37-5856902008a7_30683)
!["[Stellar Strategies] Wave Trend Pro" logo](https://cdn.ctrader.com/image/webp/5f226fbb-245a-41cd-9cdd-b018257d5e6d_28617)
!["[Stellar Strategies] Smart ADX" logo](https://cdn.ctrader.com/image/webp/af13b084-b6f6-41db-b7bc-c7e688b57b05_36929)
!["[Stellar Strategies] Linear Regression Candles 1.1" logo](https://cdn.ctrader.com/image/webp/8b9cff9f-2431-46d2-b0ec-c7f55f4a4a6d_27918)
!["[Stellar Strategies] VBO" logo](https://cdn.ctrader.com/image/webp/f034c012-94d4-445a-a01b-febd1cdedaef_36944)
!["[StellarStrategies] Scheduled Trade Executor" logo](https://cdn.ctrader.com/image/webp/daefc6af-7eca-453e-878d-1b981be2c401_25646)
!["[Stellar Strategies] Candlestick Patterns Dashboard" logo](https://cdn.ctrader.com/image/webp/ae8691a5-4884-4553-9bcc-64e16ac82a30_38344)
!["[Stellar Strategies] SP500 Gap Closure cBot 1.0" logo](https://cdn.ctrader.com/image/webp/92c23fdc-4ad1-4e61-bdb5-c77f6ec8c539_27686)
!["[Stellar Strategies] QQE" logo](https://cdn.ctrader.com/image/webp/e702104a-874c-4b39-97dd-fb34518d1015_27712)


Price
20.46M
Traded volume
8K
Pips won
25
Sales
4.41K
Free installs