
Description
This cTrader indicator identifies and visualizes the first specific market imbalances that occur during the three primary New York trading sessions. It is designed for ICT (Inner Circle Trader) practitioners who focus on "first-presented" setups as high-probability institutional footprints.
核心 (Core) Functionality
The indicator monitors the market starting at the open of each session and "locks in" the very first imbalance it finds. Once a type of imbalance (like an FVG) is drawn for a specific session, it will not draw another of that same type until the next session begins.
1. Detected Imbalance Types
- Fair Value Gap (FVG): A three-candle structure where the wick of the first candle and the wick of the third candle do not overlap, leaving a "gap" at the second candle's price range.
- Volume Imbalance (VI): Occurs when there is a gap between the bodies (Open/Close) of two consecutive candles, even if the wicks overlap.
- Liquidity Void (LV): A more extreme gap where there is no price action at all between the wicks of two consecutive candles (a total "jump" in price).
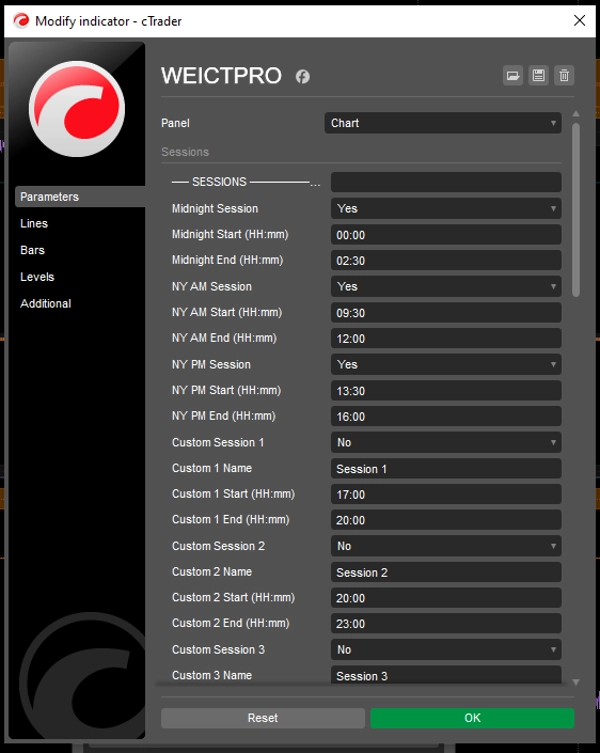
2. Monitored Sessions (New York Time)
The indicator automatically converts your chart time to Eastern Time (ET) to track:
- Midnight: 00:00 – 02:30
- NY AM: 09:30 – 12:00
- NY PM: 13:30 – 16:00
Visual Features
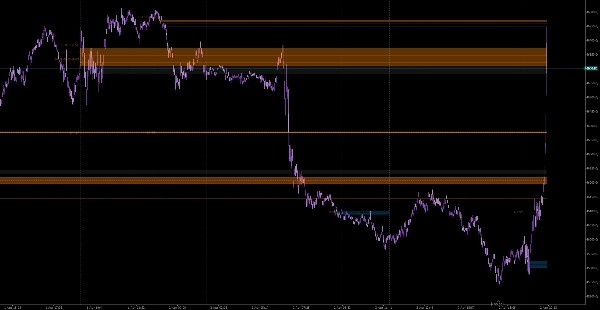
- Dynamic Extension: Boxes are drawn from the point of origin and automatically extend forward by a user-defined number of bars (
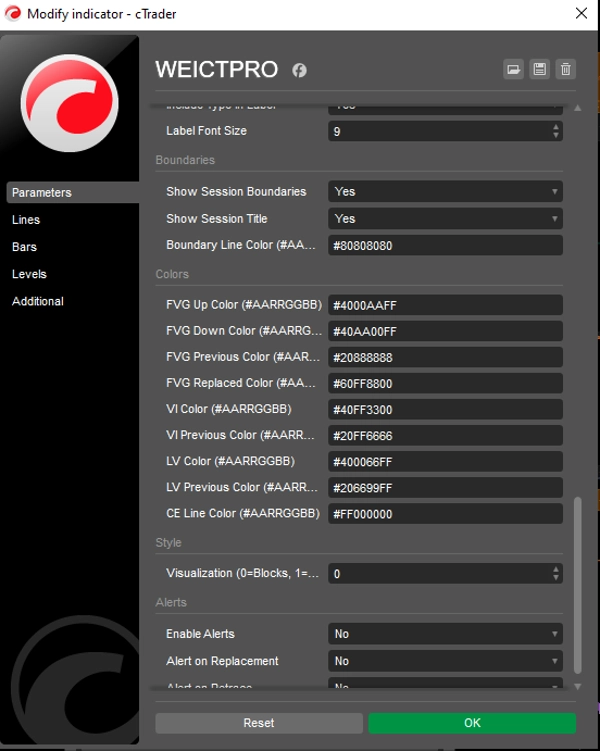
Extend Bars) to show potential future support/resistance. - Consequent Encroachment (CE): Draws a dashed midline through the imbalance. In ICT theory, the 50% level (CE) is a critical institutional reference point.
- Automated Labeling: Clearly marks each box with the session name and the imbalance type (e.g., "NY AM +FVG").
Key Parameters
Parameter
Description
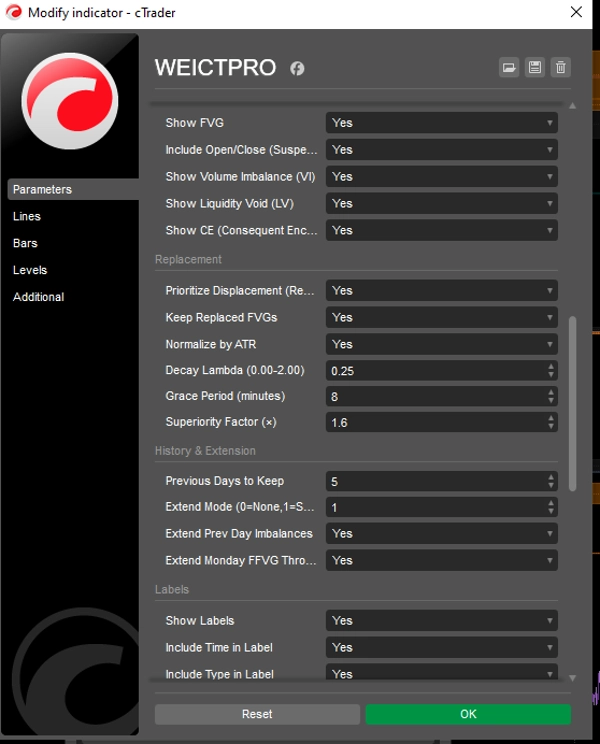
Show FVG/VI/LV
Toggle which specific imbalance types you want to track.
Box Opacity
Adjusts how "solid" the shaded areas appear on your chart.
Extend Bars
How many candles into the future the box should project.
Timezone
Hardcoded to Eastern Standard Time to ensure session accuracy regardless of your broker's server time.
Technical Recommendations
- Timeframes: Best used on M1 through M15. On higher timeframes (H1+), the sessions are too short to reliably capture the "first" presented imbalance.
- Usage: These areas often act as "magnets" for price. Traders look for price to return to these boxes (specifically the CE level) for entries before continuing in the original direction.
Summary
The indicator detects three imbalance types: Fair Value Gap (FVG), a three-candle gap where the first and third candle wicks do not overlap; Volume Imbalance (VI), a gap between the bodies of two consecutive candles; and Liquidity Void (LV), a total price jump with no price action between consecutive candle wicks. Once an imbalance type is identified in a session, it locks and does not redraw until the next session.
Visual features include dynamically extending boxes from the imbalance origin for a user-defined number of bars, a dashed midline marking the 50% level (Consequent Encroachment), and automated labeling with session and imbalance type. The indicator is hardcoded to Eastern Time for session accuracy and is best used on M1 to M15 timeframes to reliably capture the first imbalance. Users can toggle imbalance types, adjust box opacity, and set extension length. This tool supports multiple markets including Forex, indices, commodities, stocks, and cryptocurrencies.


