
Description
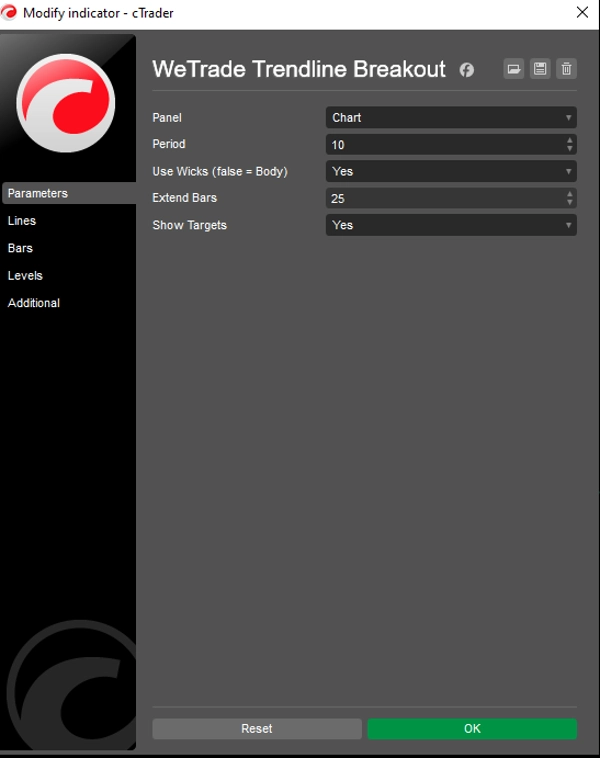
WeTrade Trendline Breakout is a smart price-action indicator that detects high-probability breakout opportunities using dynamic trendline analysis. It automatically identifies market structure, plots valid trendlines, and generates precise buy/sell signals when price breaks key levels. Built-in target projections and volatility-based buffers help traders manage risk and maximize reward with confidence.
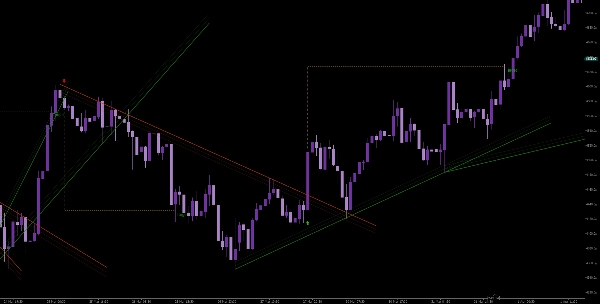
Trendline Breakouts With Targets
A smart price-action indicator that automatically detects trendline breakouts and provides clear entry signals with dynamic target levels.
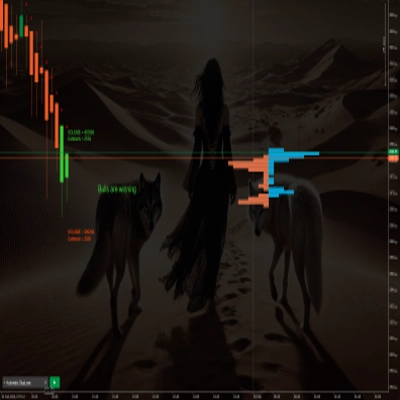
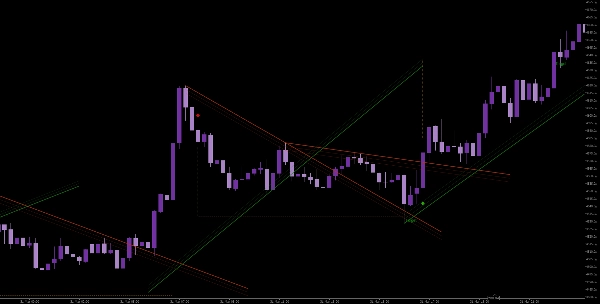
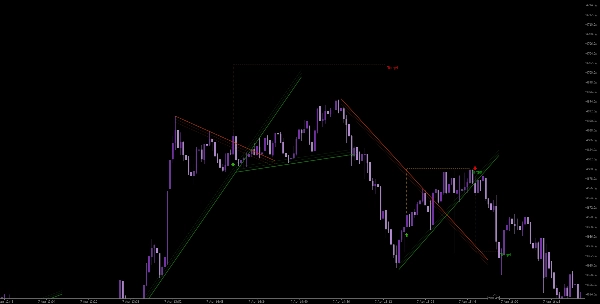
This tool identifies pivot highs and lows to draw valid trendlines based on real market structure. When price breaks a descending resistance or ascending support trendline, it generates precise buy or sell signals using close confirmation logic to reduce false breakouts.
The indicator includes adaptive volatility filtering using ATR, creating buffer zones (Z-Bands) around trendlines to improve breakout accuracy. Upon a valid breakout, it automatically plots take-profit targets and stop-loss levels, helping traders manage risk and reward efficiently.
Key features:
- Automatic trendline detection using pivot structure
- Breakout signals with confirmation logic
- ATR-based dynamic buffer zones (Z-Bands)
- Built-in take-profit and stop-loss visualization
- Clean chart display with optional target levels
- Works on all instruments and timeframes
Designed for traders who focus on structure, momentum, and disciplined execution.
Summary
Key features include ATR-based dynamic buffer zones (Z-Bands) that adapt to market volatility, enhancing breakout accuracy. Upon a confirmed breakout, the tool automatically plots take-profit targets and stop-loss levels, aiding in risk and reward management. The indicator offers a clean chart display with optional target visualization and supports all instruments and timeframes.
This tool is suitable for traders focusing on market structure, momentum, and disciplined trade execution across various markets including Forex, cryptocurrencies, commodities, indices, and stocks. It provides breakout signals and trend strength insights based on price action and volatility measures.
Customer reviews
5 | 100 % | |
4 | 0 % | |
3 | 0 % | |
2 | 0 % | |
1 | 0 % |


!["Trend Angle Indicator [Iridio Capital]" logo](https://cdn.ctrader.com/image/webp/28a98496-3412-4fea-82eb-be3347bdd6f1_27612)