
Description
Breakout Retest Indicator
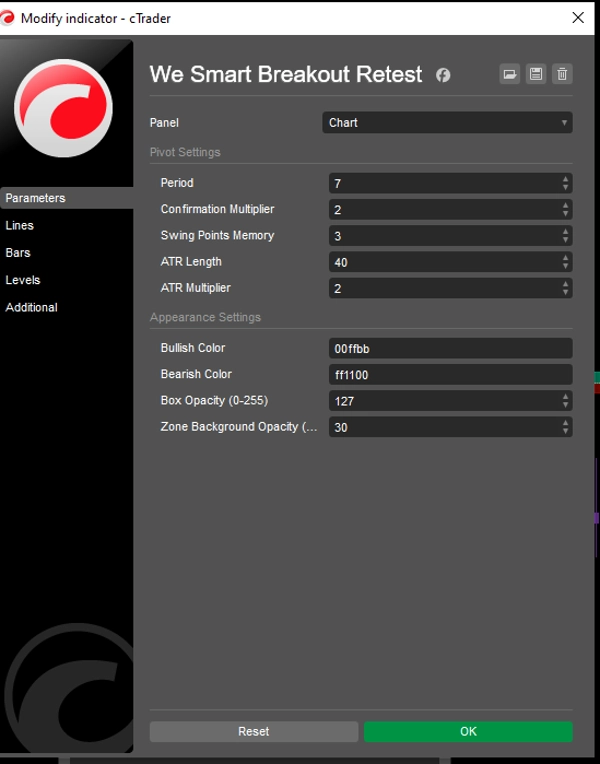
The Breakout Retest indicator is designed to automatically identify high-probability breakout and retest structures using advanced pivot analysis and volatility filtering. It detects significant swing highs and lows based on a configurable pivot period and confirmation logic, ensuring that only strong and validated market structures are considered. By incorporating an Average True Range (ATR)–based tolerance, the indicator filters out weak or noisy price movements, focusing only on meaningful breakout conditions.
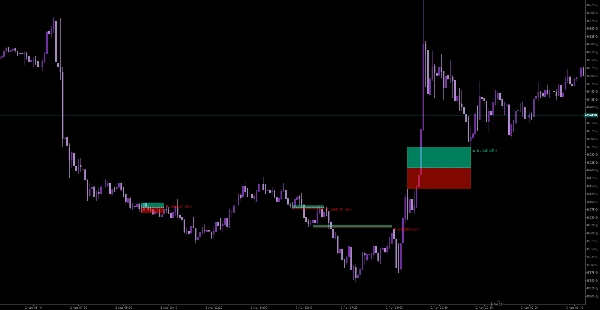
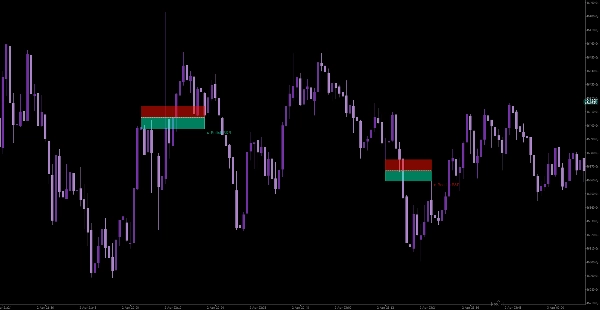
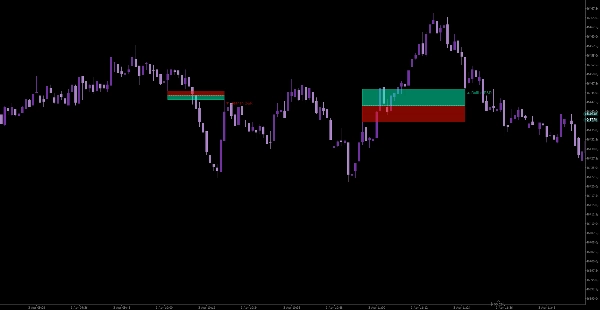
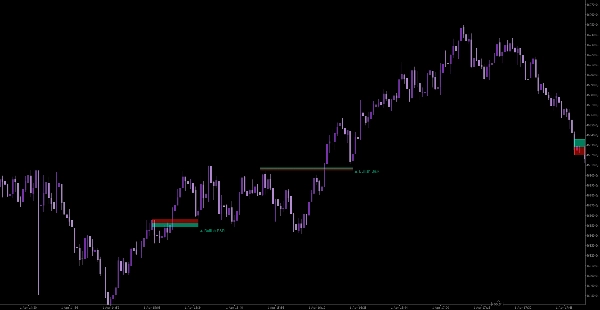
Once a valid breakout is detected, the indicator highlights the corresponding zone directly on the chart using visually distinct colored boxes. The zone is divided into upper and lower halves to clearly represent bullish and bearish reaction areas, along with a midpoint line that acts as a key equilibrium level. Labels are also displayed to indicate whether the setup is a bullish or bearish breakout and retest, helping traders quickly interpret market direction.
This tool is especially useful for traders who rely on price action, structure, and liquidity concepts. It helps in identifying precise entry zones after breakouts, improving timing and risk management. With customizable parameters for pivots, ATR sensitivity, and visual appearance, the indicator can be adapted to different trading styles, timeframes, and instruments such as XAUUSD.


