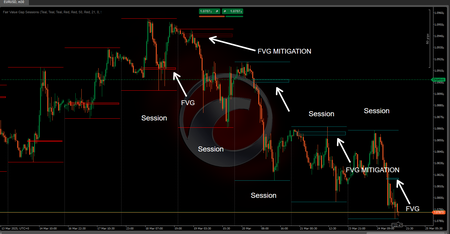
Pinescriptlabs Store indicators: Pinescriptlabs Store cBots : (cBot) Gold & BTC BreakoutSession Pivots(new)
Trailing Smart Algorithm (New)
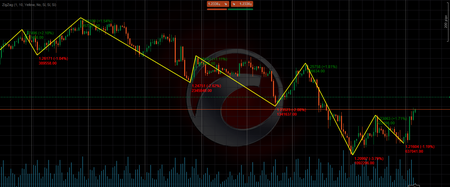
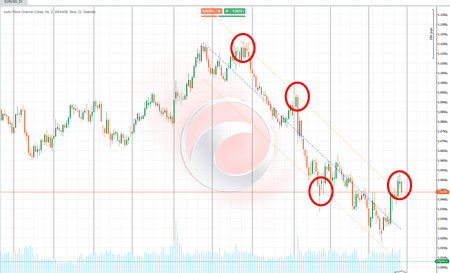
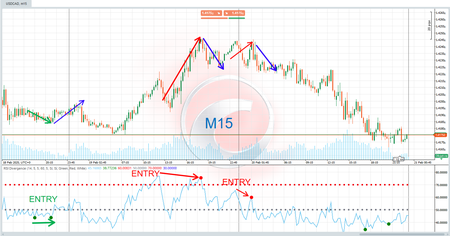
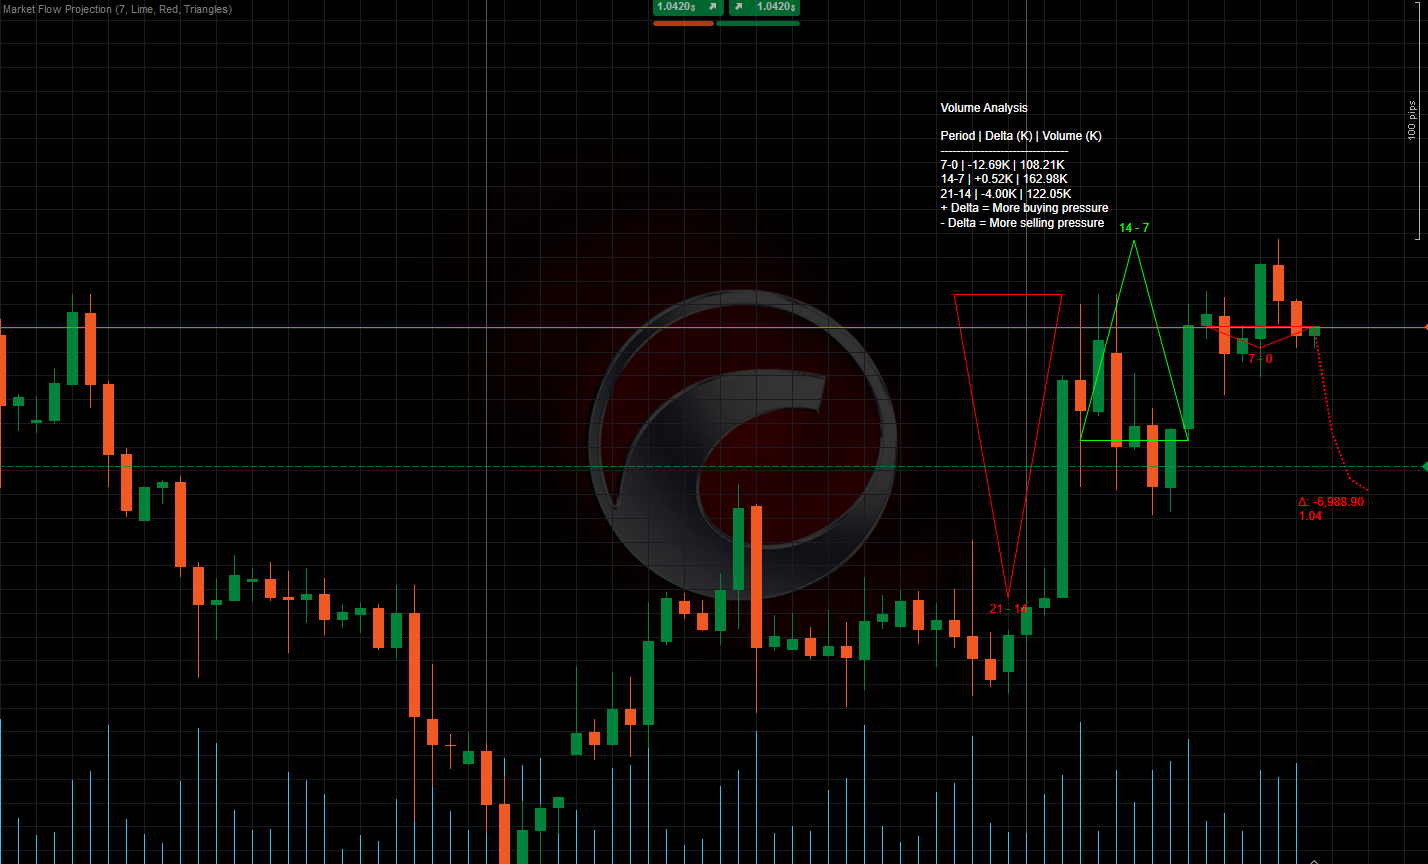
Prediction Based on Linreg & ATR
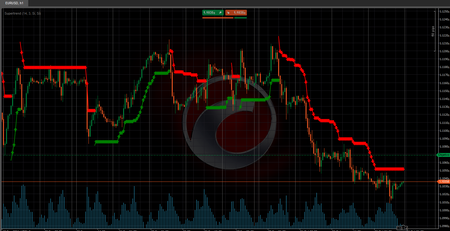
SmartTrend Support &
Resistance
Lines
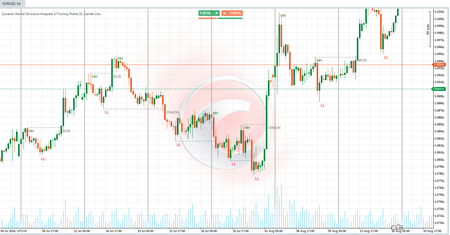
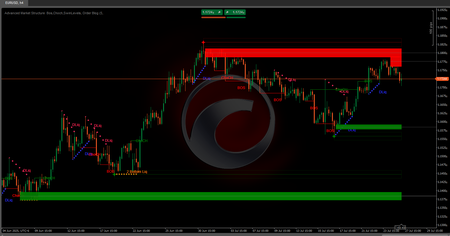
Dynamic
Market Structure
Analysis
of
Turning
Points
Fibonacci
Linear
Regression
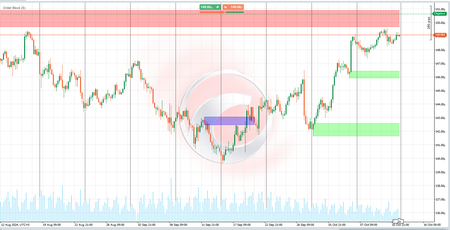
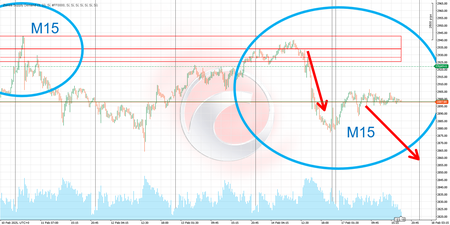
Multi-timeframe
Auto
Support and
Resistance
Trend
Lines
All
Support and
Resistance
Levels
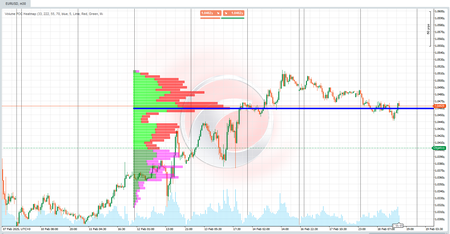
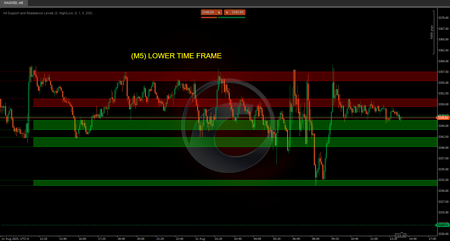
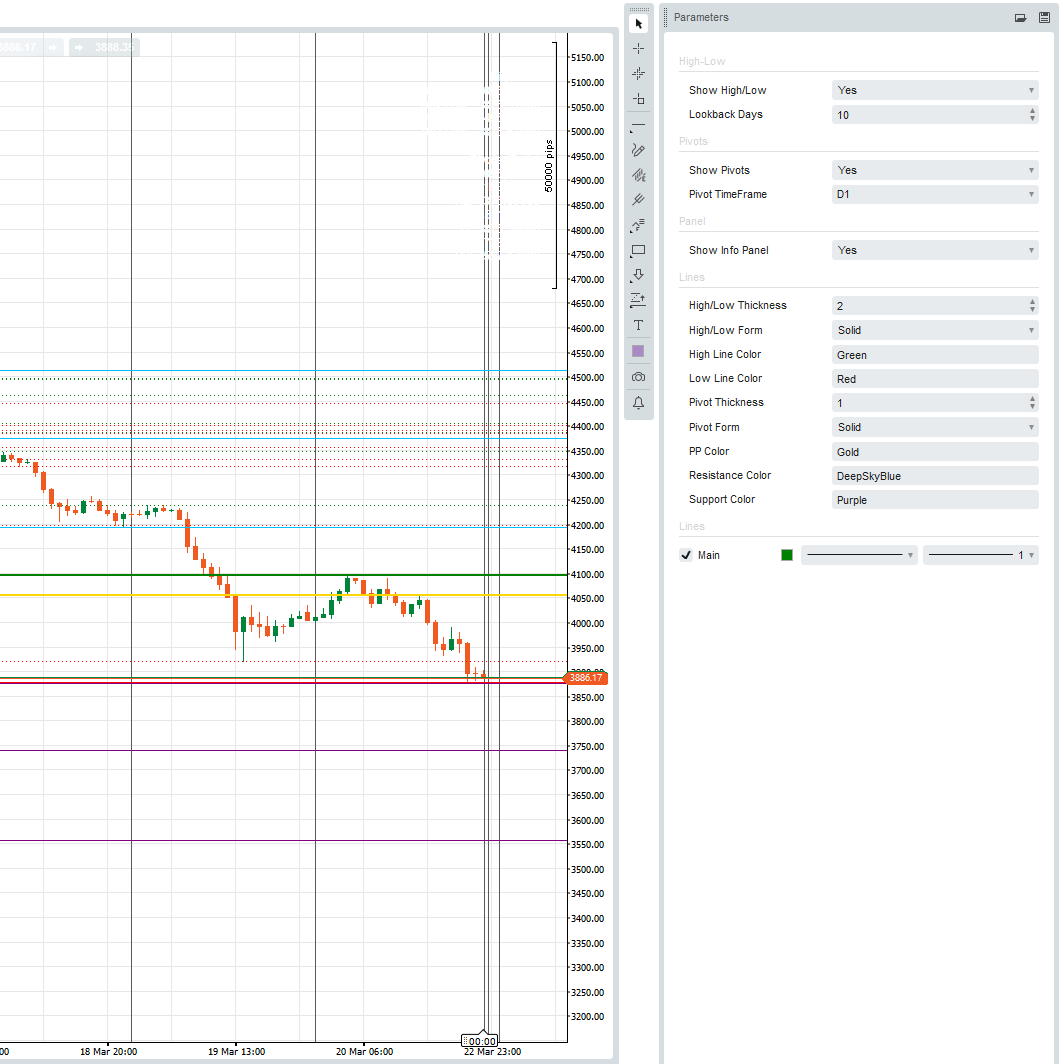
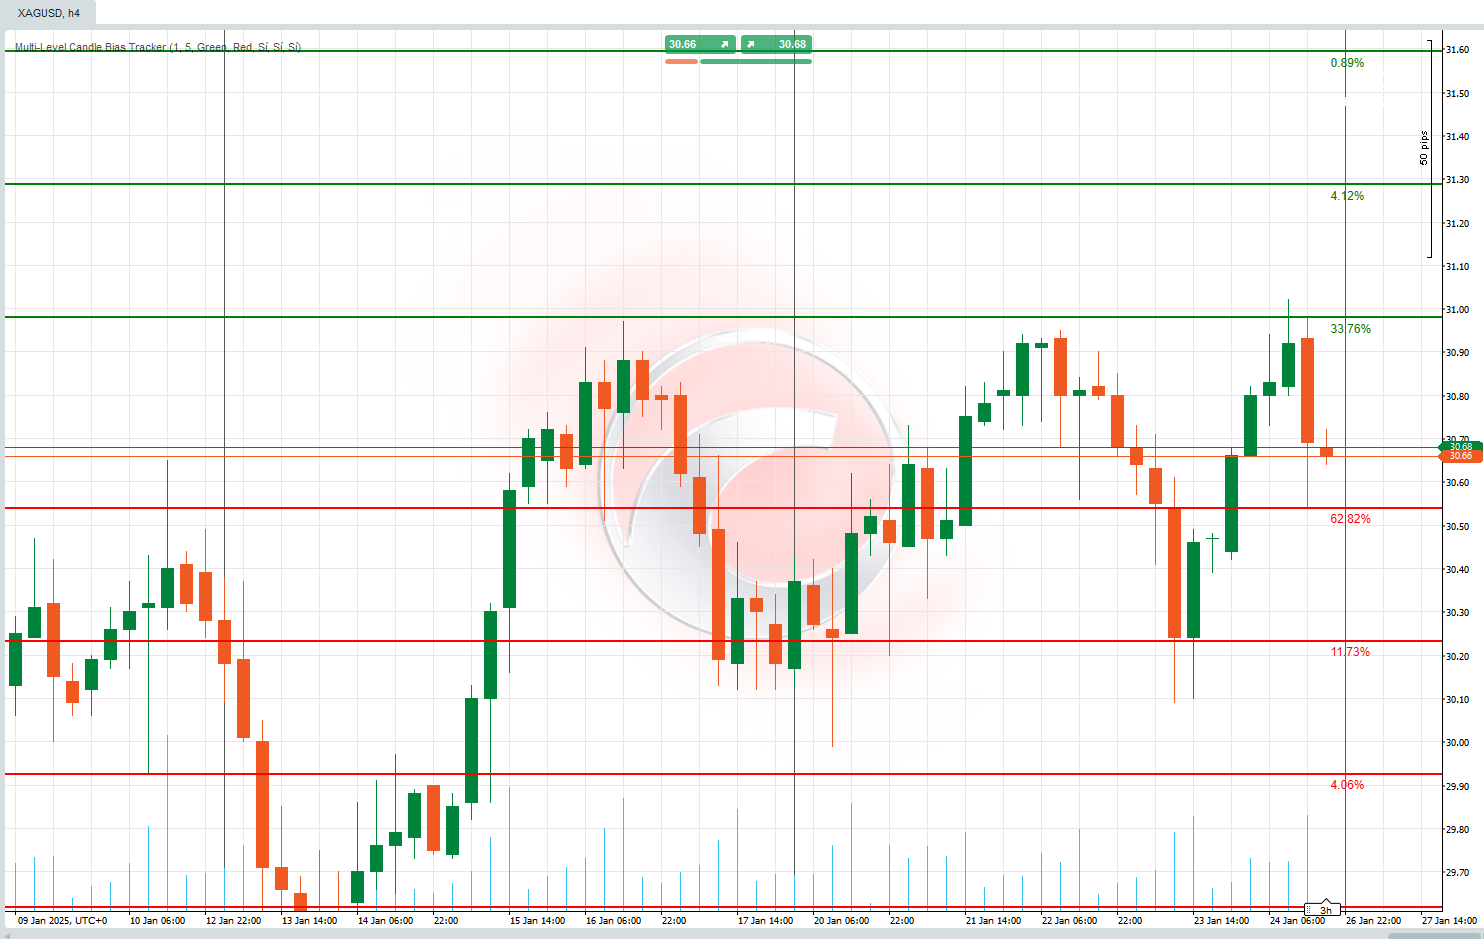
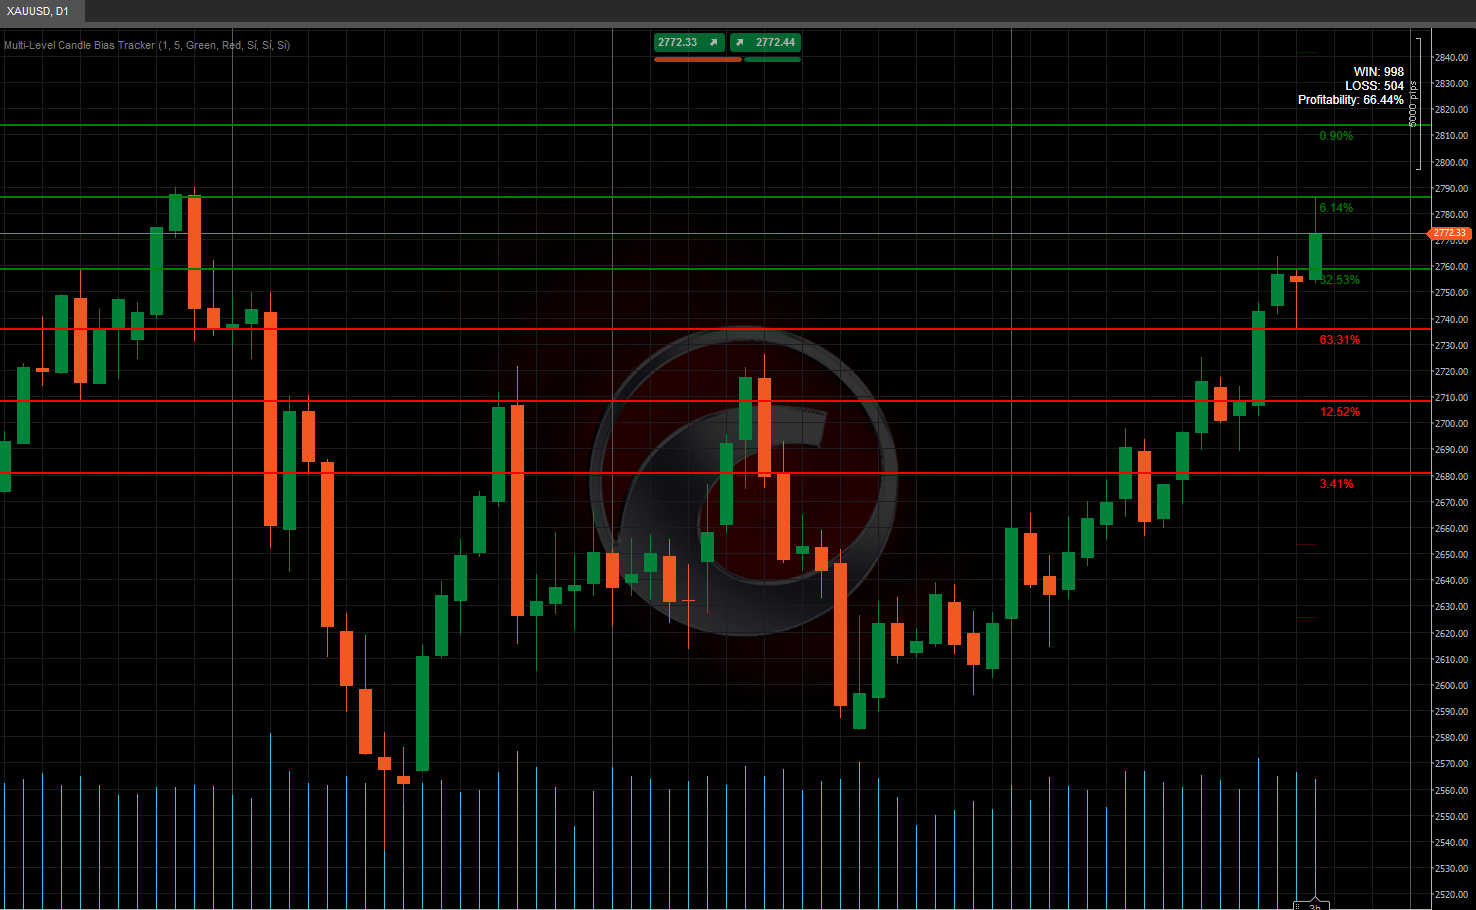
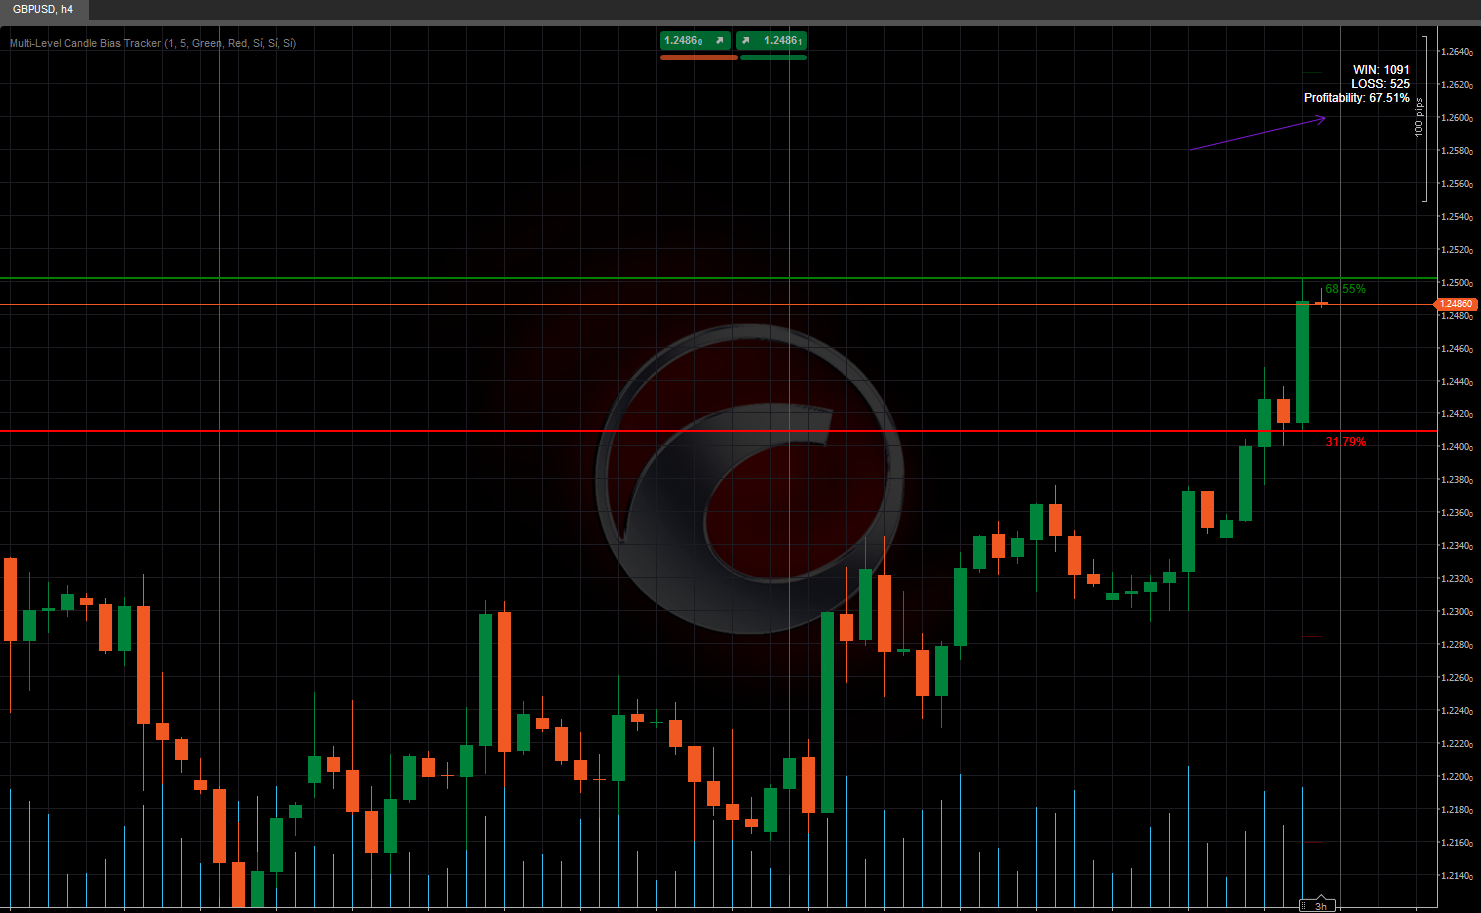
This algorithm determines the likelihood of the price reaching a new high or low and represents it as a level on the chart, accompanied by its corresponding percentage. This calculation is backtested, and the results are displayed in a table, making it easy to understand the probability of the next candle setting a new high or low. 📈📉
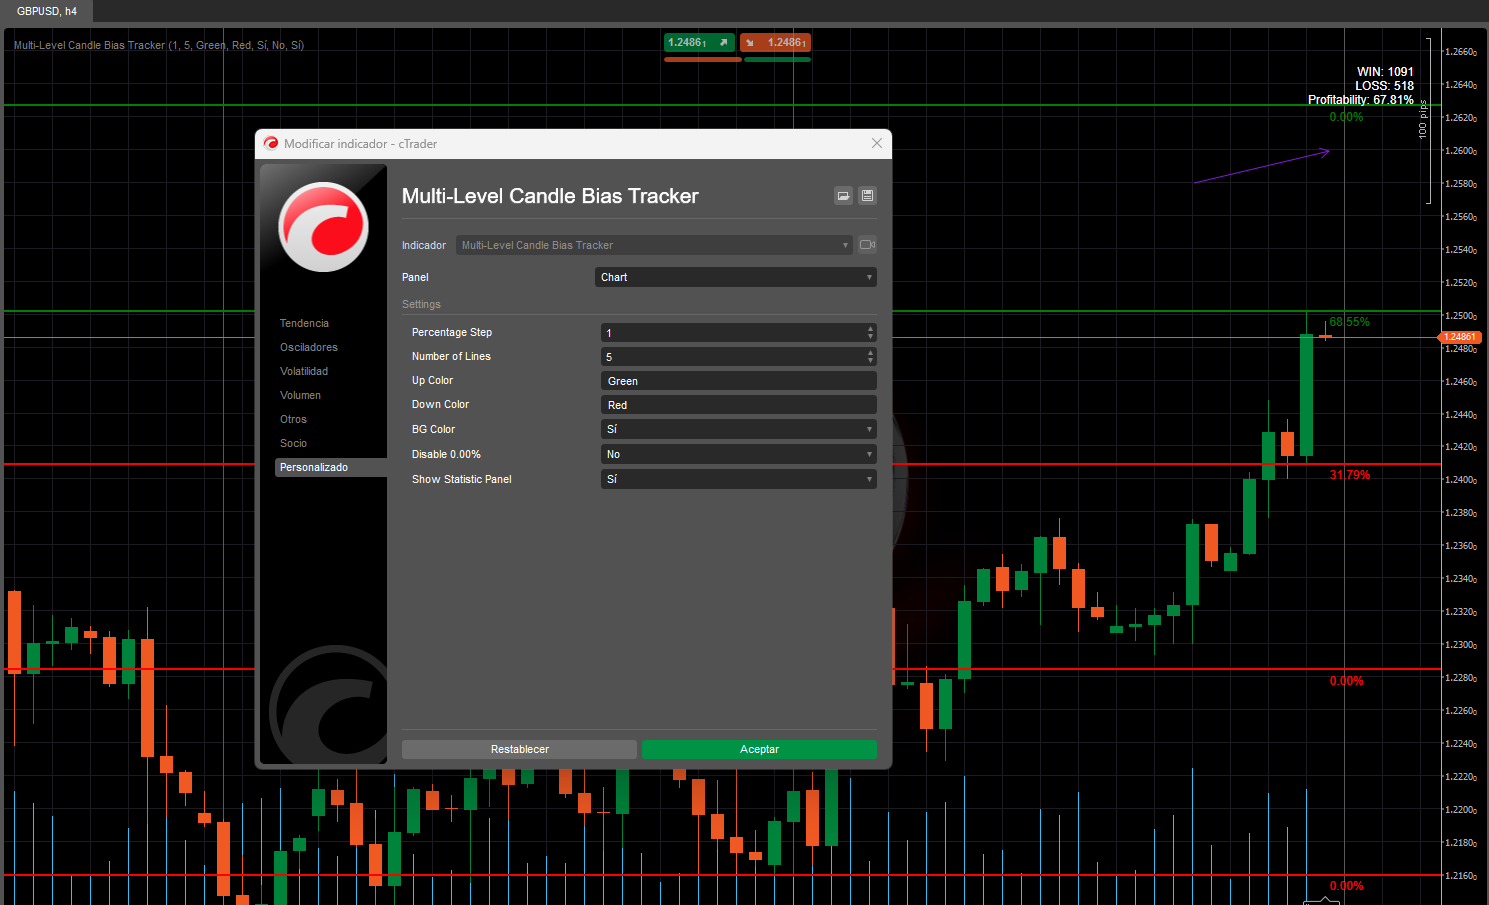
How does it work? 🛠️
- Probabilities of New Highs and Lows 🎯
- The algorithm analyzes past price behavior to calculate the probability of the price making a new high or low in the next candle.
- For example, if the probability of a new high is 70%, it’s more likely the price will go up. ⬆️
- Levels with Percentages 📏
- It draws horizontal lines on the chart representing key levels, along with a percentage indicating the probability of the price reaching that level.
- These levels are calculated using a percentage you define (e.g., 1%).
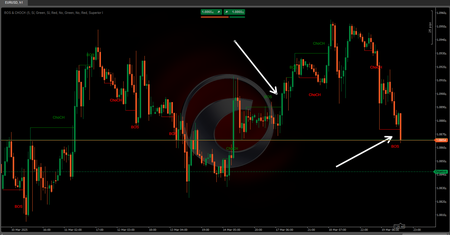
- Statistics Panel 📊
- It shows how many times the price has reached those levels (successes) and how many times it hasn’t.
- It also provides an effectiveness percentage, telling you if those levels have been reliable in the past. ✅❌
What is it for?
- Understand price direction: Helps you know whether the price is more likely to go up or down in the next candle. ⬆️⬇️
- Manage risk: If a level has a low probability, you can avoid it to reduce risky decisions.
How would you use it?
- Observe the levels: Look at the lines the algorithm draws on the chart. 👀
- Check the probabilities: If a level has a high probability (e.g., 70%), it’s more likely the price will reach it. 📈
- Use the statistics panel: Review whether those levels have worked well in the past to decide if you trust them. 📊
5 | 100 % | |
4 | 0 % | |
3 | 0 % | |
2 | 0 % | |
1 | 0 % |