Описание
Описание продукта: Панель производительности BullMoon
Панель BullMoon Performance Panel — это мощный аналитический инструмент для cTrader, разработанный, чтобы помочь трейдерам отслеживать свою производительность в реальном времени и визуально восстанавливать прошлые сделки прямо на графике.
1. Рыночные данные и условия
Панель анализирует ваши данные по сделкам, связанные с аккаунтом и исторические данные о ценах выбранного символа.
- Она оценивает как закрытые, так и открытые сделки для расчёта ключевых показателей, таких как чистая прибыль, просадка и коэффициент выигрышей.
- Индикатор сканирует вашу историю, чтобы точно определить точки входа и выхода.
2. Интерпретация сигналов и визуальных элементов
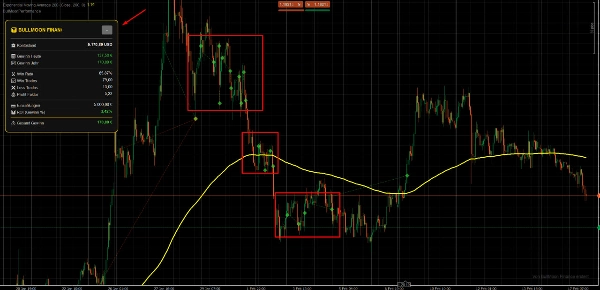
Чтобы сделать анализ максимально интуитивным, инструмент использует чёткие визуальные маркеры прямо на графике:
- Символы: Входы и выходы отмечены специальными символами (например, стрелками или точками), что позволяет сразу увидеть, где была открыта и закрыта позиция.
- Визуальные линии: Линии, соединяющие эти символы, иллюстрируют продолжительность сделки, делая фазы прибыли или убытка визуально ощутимыми.
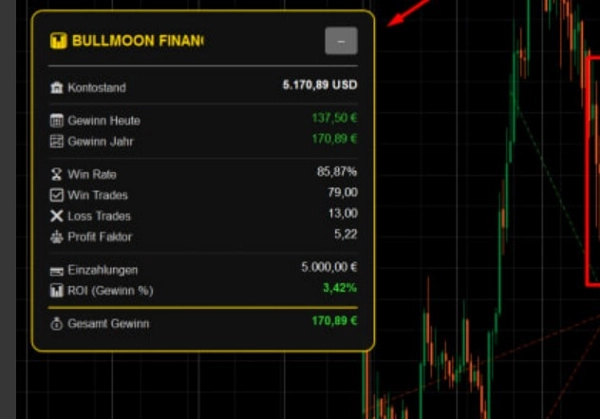
- Панель управления: Компактная панель на экране предоставляет точные данные, включая прибыль в USD, общее количество лотов и коэффициент R.
3. Основные настройки и параметры
Вы можете настроить панель под свой конкретный стиль торговли:
- Период истории: Определите, сколько дней прошлых сделок должно отображаться на графике.
- Визуальные элементы: Цвета для выигрышных и проигрышных сделок, а также прозрачность линий и символов полностью настраиваются.
- Основы расчёта: Установите фиксированные размеры лотов или процентный риск для статистического вывода.
4. Типичные случаи использования и торговые сценарии
- Анализ после сделки: Просмотрите свой торговый день, чтобы убедиться, что вы правильно следовали своей стратегии.
- Оптимизация стратегии: Визуально определите, установлены ли уровни Take Profit или Stop Loss постоянно слишком узко или слишком широко.
- Мониторинг в реальном времени: Отслеживайте свою текущую дневную производительность без необходимости переключаться между вкладками истории аккаунта.
5. Целевая аудитория (размер счета и опыт)
- Уровень опыта: Подходит для начинающих, желающих лучше понять свои сделки, а также для профессионалов, которым нужен быстрый визуальный контроль производительности.
- Размер счета: Подходит для любого размера счета. Особенно ценен для трейдеров, одновременно использующих несколько стратегий и нуждающихся в чётком обзоре.
6. Важные ограничения и примечания по использованию
- Платформа: Разработана исключительно для cTrader.
- Доступность данных: Отображение исторических сделок зависит от наличия данных в истории вашего аккаунта cTrader.
- Не является генератором сигналов: Обратите внимание, что эта панель является аналитическим инструментом и не генерирует независимые сигналы на покупку или продажу.
Сводка
The panel features a compact dashboard displaying key statistics including profit in USD, total lots traded, and the R-factor. Users can customize the display period for historical trades, adjust colors and transparency of visual elements, and set calculation parameters based on fixed lot sizes or percentage risk.
Typical use cases include post-trade analysis, strategy optimization by evaluating take profit and stop loss settings, and live monitoring of daily performance without switching views. The tool supports various markets and symbols such as Forex (EURUSD, GBPUSD, USDJPY), Indices (NAS100), Commodities (XAUUSD), Crypto (BTCUSD), and Stocks. It is suitable for traders of all experience levels and account sizes, especially those managing multiple strategies simultaneously. The panel is strictly an analytical tool and does not generate trade signals.
Отзывы покупателей
5 | 100 % | |
4 | 0 % | |
3 | 0 % | |
2 | 0 % | |
1 | 0 % |