Описание
Heikin Ashi Structure Bias (индикатор cTrader)
Автоматические зоны спроса и предложения с мультивременным уклоном.
Что он делает – простыми словами
Этот индикатор автоматически:
- Считывает ценовое движение Heikin Ashi и обнаруживает значимые поворотные точки.
- Строит динамические зоны поддержки и сопротивления вокруг этих поворотных точек, используя как экстремумы теней, так и тело свечи (а не просто случайные линии).
- Интеллектуально объединяет близлежащие зоны, чтобы вы видели чистые, торгуемые уровни вместо множества горизонтальных линий.
- Генерирует четкий бычий или медвежий уклон всякий раз, когда цена полностью пробивает последнюю зону поддержки или сопротивления.
- Показывает вам уклон для:
-
- Вашего таймфрейма графика, и
- Опционального старшего таймфрейма (по умолчанию H2) — без загромождения графика данными старшего таймфрейма.
Результат: одним взглядом вы понимаете где настоящие уровни и наклон рынка в данный момент — вверх или вниз.
Проблема, которую он решает
У большинства трейдеров одни и те же проблемы:
- Линии поддержки/сопротивления, нарисованные вручную, являются:
-
- субъективными,
- несогласованными,
- и часто чрезмерными.
- Простые индикаторы “зигзаг + горизонтальная линия”:
-
- не учитывают ширину зоны должным образом,
- накладывают уровни друг на друга,
- или расширяют зоны настолько, что они занимают половину графика.
- Уклон часто “в голове” — его нельзя четко увидеть или использовать по правилам.
Этот индикатор создан для того, чтобы:
- Преобразовать структуру Heikin Ashi в четкие, объективные зоны,
- Дать вам тренд/уклон на основе правил, основанный на этих зонах,
- При этом сохраняя график чистым и читаемым.
Как строятся зоны (объяснение для трейдеров)
Для каждого поворота Heikin Ashi индикатор рассматривает структуру из 3 свечей:
- Когда HA меняется с красного на зеленый, это отмечает поворотную точку поддержки.
- Когда HA меняется с зеленого на красный, это отмечает поворотную точку сопротивления.
Затем строится зона:
Зоны поддержки
- Находит самую низкую тень среди 3 свечей (истинный экстремум).
- Находит следующий по высоте минимум, который все еще выше этого экстремума.
- Использует тело свечи (открытие/закрытие) рядом с этим внутренним минимумом для определения “торгуемой” стороны зоны.
- Итоговая зона поддержки:
-
- Низ = экстремум тени,
- Верх = внутренний уровень на основе тела свечи.
Зоны сопротивления
- Находит самую высокую тень среди 3 свечей.
- Находит следующий по высоте максимум, который все еще ниже этого экстремума.
- Использует тело рядом с этим внутренним максимумом.
- Итоговая зона сопротивления:
-
- Верх = экстремум тени,
- Низ = внутренний уровень на основе тела свечи.
Таким образом, каждая зона — это не просто произвольная полоса:
Это диапазон от тени до тела свечи, который показывает, где цена действительно оттолкнулась или развернулась.
Логика объединения (почему график остается чистым)
Зоны одного типа (поддержка с поддержкой, сопротивление с сопротивлением):
- Рассматриваются как единицы на временной шкале.
- Могут объединяться только если они фактически перекрываются по цене.
- Объединение строго локальное:
-
- Новая зона может объединиться с:
-
- самой последней зоной (подряд), или
- второй по последователности зоной (+1 промежуток), и
- Еще одним “якорным” объединением позади, если новая объединенная зона теперь перекрывает предыдущую структуру.
Это сохраняет поведение интуитивным:
- Зоны не “поглощают” всю историю.
- Старые уровни уважаются, но не допускается создание гигантских мегазон.
- Локальная структура типа A–B–C или A–C+D обрабатывается контролируемо.
Логика уклона (как вы на самом деле торгуете с ним)
Для каждого таймфрейма (основного и старшего):
- Индикатор отслеживает последнюю объединенную зону поддержки и последнюю объединенную зону сопротивления.
- Затем, на каждой закрытой свече:
-
- Если цена закрывается выше последней зоны сопротивления → уклон становится бычьим.
- Если цена закрывается ниже последней зоны поддержки → уклон становится медвежьим.
Он хранит:
- Время последнего изменения уклона,
- Ценовой уровень, на котором цена пробила зону.
На графике небольшой текстовый панель показывает:
Основной (H1) уклон: БычийОсновное (H1) изменение: 26.11 15:00 @1.08750
Если старший таймфрейм включен, вы также увидите что-то вроде:
Старший таймфрейм (H2) уклон: МедвежийСтарший таймфрейм (H2) изменение: 25.11 08:00 @1.09200
Вы также можете включить звуковое оповещение при смене уклона основного таймфрейма.
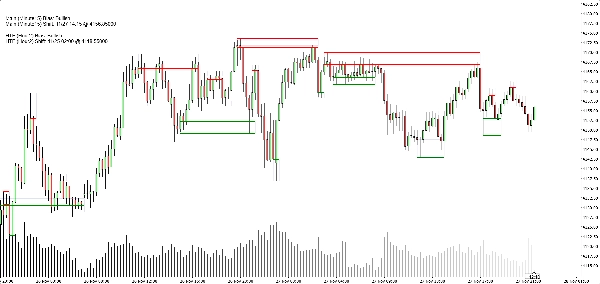
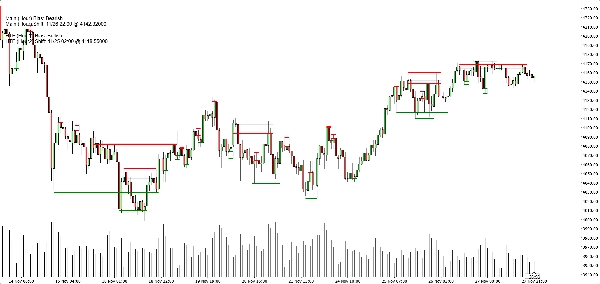
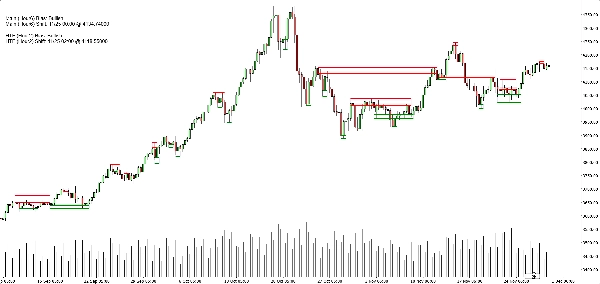
Что вы видите на графике
- Зоны поддержки:
-
- Зеленые горизонтальные базовые/триггерные линии (опционально),
- Мягкий темно-синий прямоугольник (с очень низкой непрозрачностью), показывающий полную полосу поддержки.
- Зоны сопротивления:
-
- Красные линии + мягкий темно-синий прямоугольник для полосы.
- Переключатели чистого отображения:
-
- Показать/скрыть зоны поддержки,
- Показать/скрыть зоны сопротивления,
- Включить/выключить залитые прямоугольники,
- Включить/выключить базовые/триггерные линии,
- Включить/выключить панель уклона.
Это позволяет разным трейдерам выбирать между:
- Более минималистичным видом (возможно, только прямоугольники), или
- Более точным отображением (видны точные линии).
Типичные случаи использования
Вы можете позиционировать его как полезный для:
- Фильтрации тренда
-
- Искать покупки только когда и основной, и старший таймфреймы имеют бычий уклон.
- Искать продажи только когда оба уклона медвежьи.
- Входы по зонам
-
- Использовать зоны как области интереса для:
-
- Лимитных ордеров,
- Входов по подтверждению (например, цена возвращается в пробитую зону и снова отскакивает),
- Размещения стопа чуть за внешней границей.
- Анализа сверху вниз
-
- Уклон старшего таймфрейма (по умолчанию H2) как общая картина,
- Уклон таймфрейма графика для тайминга,
- Зоны для конкретных уровней исполнения.
Чего он НЕ делает (важно для честной продажи)
- Это не робот, который торгует автоматически за вас.
- Это не “святой грааль” сигнал, гарантирующий прибыль.
- Это движок структуры и уклона:
-
- Объективно определяет зоны,
- Объективно определяет тренд/уклон на основе этих зон,
- Оставляет фактическое управление сделками трейдеру/стратегии.
Сводка
It provides a rule-based bullish or bearish bias by tracking price breaks above resistance or below support zones on both the current chart timeframe and an optional higher timeframe. This bias is displayed on a built-in dashboard panel, with optional sound alerts for bias changes.
The indicator works across all timeframes and markets where price forms swings, including forex, crypto, stocks, and futures. It features customizable lookback periods, automatic cleanup of old zones, and toggles for display elements to suit different trader preferences.
Typical uses include trend filtering by aligning biases across timeframes, identifying zone entries for limit or confirmation orders, and supporting top-down analysis. The tool timestamps and sequences pivots and bias shifts, facilitating automation or journaling. It is a structure and bias engine that aids traders in objectively defining market levels and trends while maintaining chart clarity.
Отзывы покупателей
5 | 33 % | |
4 | 67 % | |
3 | 0 % | |
2 | 0 % | |
1 | 0 % |