
Описание
Индикатор Fair Value Gap
Обзор
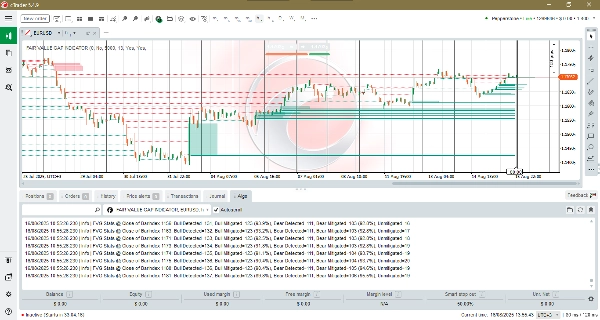
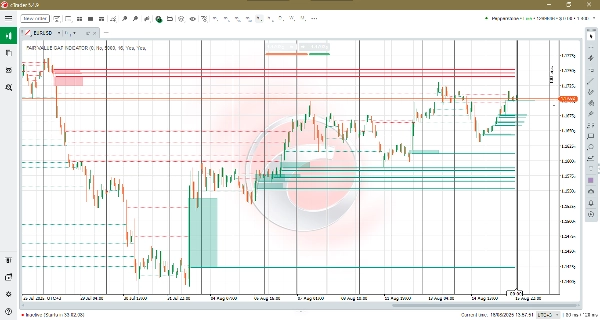
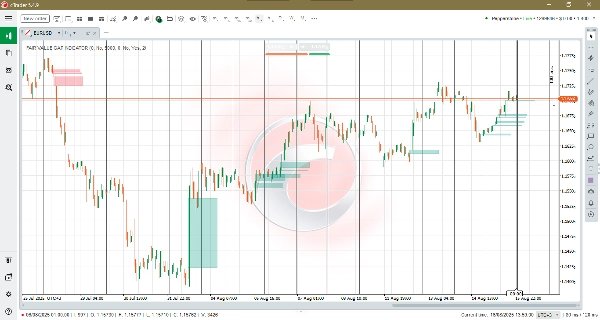
Индикатор Fair Value Gap — это точный инструмент для трейдеров, работающих с ценовым действием, которые хотят выявлять, отслеживать и подтверждать краткосрочные рыночные дисбалансы. Он автоматически обнаруживает бычьи и медвежьи Fair Value Gaps (FVG), выделяет активные (неустранённые) зоны на вашем графике и фиксирует, когда цена впоследствии заполняет (устраняет) эти зоны. Лёгкий и не перерисовывающийся (работает на закрытых барах), этот индикатор предназначен для надёжного анализа в реальной торговле и бэктестинге.
Ключевые особенности
- Автоматическое обнаружение FVG: Надёжная логика на основе 3 баров выявляет как бычьи, так и медвежьи зоны дисбаланса и отображает чистые прямоугольные зоны на графике.
- Отслеживание устранения: Когда цена закрывается через зону, индикатор удаляет прямоугольник и может нарисовать постоянную пунктирную линию устранения для исторической справки.
- Наложение неустранённых уровней: Показывает N самых последних незаполненных уровней в виде жирных горизонтальных линий, проведённых от бара обнаружения до текущего формирующегося бара. Это облегчает визуальный просмотр активных (неустранённых) Fair Value Gaps и быстрое определение их ценовых уровней.
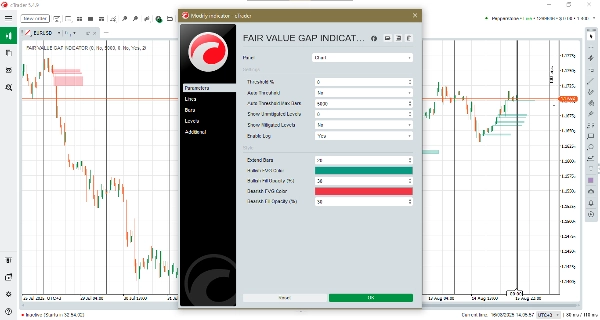
- Ручное и автоматическое пороговое значение: Выберите фиксированный относительный порог или включите Автоматический порог, чтобы индикатор адаптировался к недавней рыночной активности.
- Максимальное количество баров для Авто Порога: Управляет размером скользящего окна, используемого для вычисления автоматического порога. Большие значения сглаживают порог (стабильный на протяжении более длительной истории); меньшие значения делают его более чувствительным к недавней волатильности.
- Пользовательские визуальные настройки и проекция: Установите длину проекции (на сколько далеко проецируются прямоугольники), цвет и прозрачность заливки для бычьих и медвежьих зон, чтобы соответствовать стилю вашего графика.
- Логирование в терминале: Компактные строки журнала сообщают об общем количестве обнаруженных FVG, устранениях и текущем количестве неустранённых — идеально для проверки и настройки стратегии.
- Логика закрытых баров: Разработан для работы один раз на закрытом баре, чтобы минимизировать перерисовку.
Преимущества
- Чёткие торговые ориентиры: Быстро находите зоны дисбаланса, которые могут служить целями возврата, зонами реакции или ориентирами для управления сделками.
- Валидация и статистика: Используйте логи терминала и проценты устранения для проверки сигналов и настройки чувствительности вашей стратегии.
- Адаптивная чувствительность: Автоматический порог + Максимум баров позволяет индикатору надёжно работать как на спокойных, так и на волатильных рынках без постоянной ручной перенастройки.
- Компактная и ненавязчивая визуализация: Минимальный визуальный след сохраняет читаемость ваших графиков, при этом сохраняя важный контекст.
Идеально подходит для
Дейтрейдеров, свинг-трейдеров и скальперов, которые полагаются на ценовое действие и концепции дисбаланса, а также аналитиков, проверяющих реакции потока ордеров и эффективность стратегий.
Заключение
Индикатор Fair Value Gap сочетает точное обнаружение дисбаланса с аналитикой устранения и адаптивным порогом, предоставляя вам сфокусированный, с низким уровнем шума обзор рыночных дисбалансов. Используйте его, чтобы выявлять потенциальные возвраты цены, более разумно управлять сделками и измерять, как часто зоны заполняются на вашем рынке.
Сводка
Key features include automated FVG detection, mitigation tracking, and an overlay showing recent unmitigated levels as bold horizontal lines for easy visual scanning. Users can select manual or automatic thresholding to adapt sensitivity to market conditions, with adjustable parameters controlling the responsiveness of the auto threshold. Customizable visual settings allow traders to tailor the appearance of bullish and bearish zones.
The indicator operates on closed bars to minimize repainting, ensuring reliable signals for live trading and backtesting. Terminal logging provides concise statistics on detected gaps and mitigations, aiding validation and strategy tuning.
Suitable for day traders, swing traders, scalpers, and analysts, the Fair Value Gap Indicator supports markets including Forex, indices, commodities, cryptocurrencies, and stocks. It offers a focused, low-noise view of market imbalances to assist in identifying potential price return targets and managing trades.
Отзывы покупателей
5 | 100 % | |
4 | 0 % | |
3 | 0 % | |
2 | 0 % | |
1 | 0 % |


