
Descrizione
🚀 Sistema di Rottura del Canale
Questo algoritmo specializzato è progettato per confermare con precisione i punti di ingresso e uscita 🎯 combinando più elementi di analisi tecnica per fornire segnali affidabili.
🔍 Come Funziona?
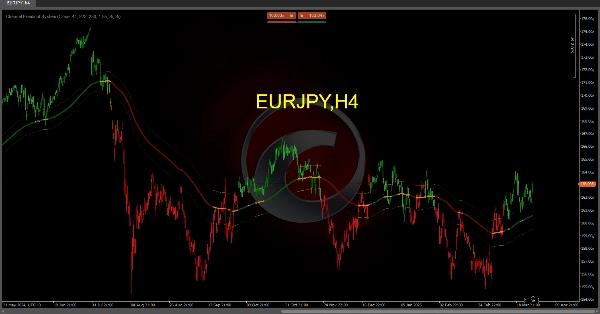
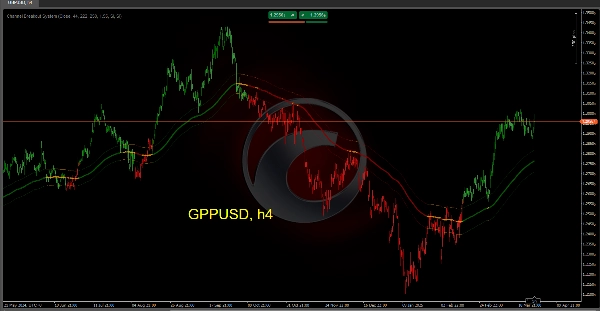
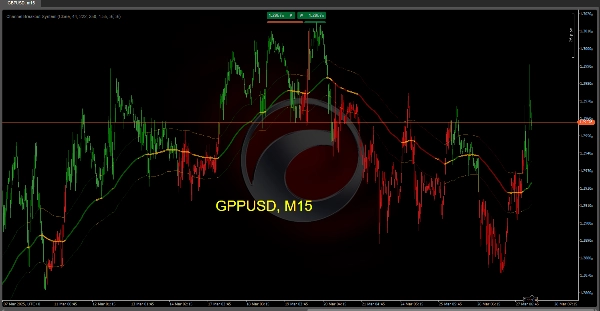
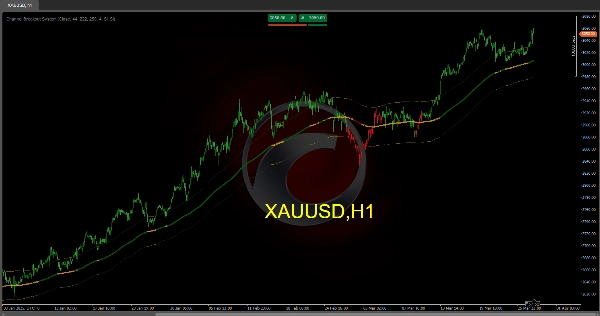
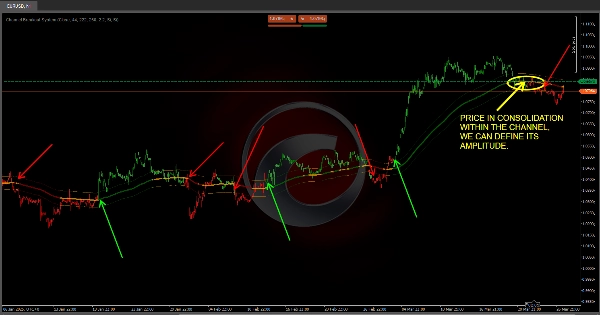
📊 Canale Basato sulla Volatilità (ATR)
✅ La volatilità del mercato viene calcolata utilizzando l'ATR (Average True Range) 📉.
✅ La "Trend MA" viene regolata aggiungendo e sottraendo un valore proporzionale a questa volatilità, formando due linee tratteggiate che fungono da "soffitto" e "pavimento" del mercato.
✅ Cosa significa questo per te? Se il prezzo rimane all'interno del canale, il mercato potrebbe essere in fase di range o consolidamento; se rompe chiaramente, è un segnale di un forte movimento di tendenza 📈📉.
✅ Completamente personalizzabile! Regola le impostazioni del canale per adattarle alla tua strategia 📌.
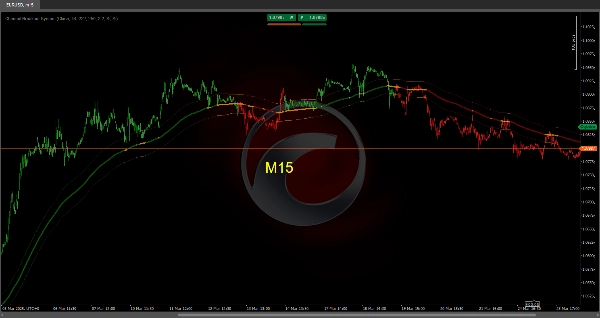
🟢 Rilevamento della Tendenza con Colori Intelligenti
🔹 L'indicatore confronta la posizione della MA veloce con la MA media, e entrambe in relazione alla Trend MA.
🔹 In base alla fase di mercato, le candele cambiano colore:
- 🟢 Verde → Fase di mercato rialzista.
- 🔴 Rosso → Fase di mercato ribassista.
- 🟠 Arancione o neutro → Possibile consolidamento o incertezza.
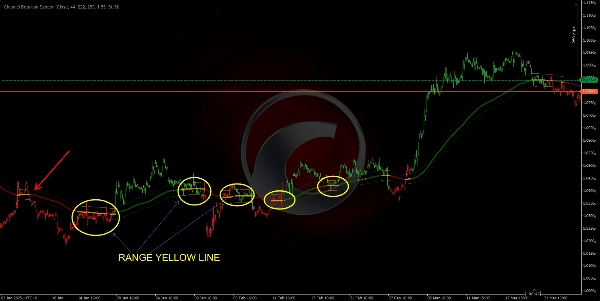
🔹 Se il prezzo e le medie mobili sono "bloccati" all'interno del canale, segnala una fase di consolidamento, aiutandoti a evitare di operare in zone indecise.
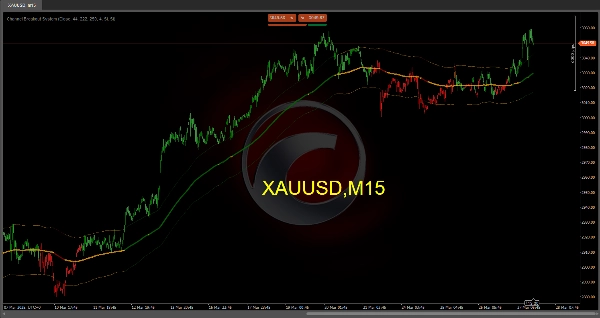
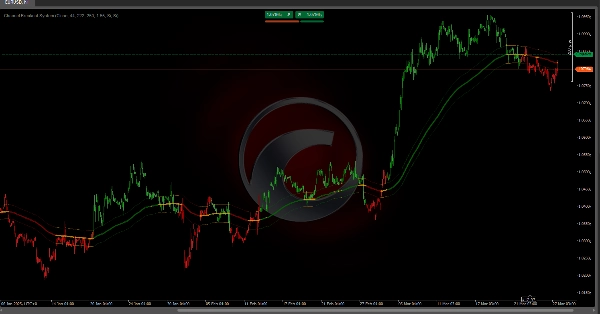
🎯 Come Appare sul Grafico
🔵 Linea di tendenza principale: Cambia colore a seconda della direzione del mercato (verde, rosso o arancione).
📏 Canale tratteggiato: Riflette il range di mercato basato sulla volatilità.
📊 Barre colorate: Forniscono una rappresentazione visiva semplice della fase di mercato attuale.
🚀 Perché Usare Questo Sistema?
✔ Identifica rapidamente se il mercato è in trend o in range.
✔ Evidenzia visivamente la forza e la direzione della tendenza.
✔ Anticipa potenziali inversioni con segnali chiari di breakout e crossover.
✔ Conferma i punti di ingresso e uscita, riducendo i falsi segnali e migliorando la precisione delle operazioni.
🔹 Ottimizza il tuo trading e opera con maggiore fiducia utilizzando Channel Breakout System 🏆. Preparati a individuare le migliori opportunità di mercato! 📈🔥
Indicatori del Ctrader Store:
Dynamic Market Structure
Analysis of Turning Points
Fibonacci Linear
Regression Multi-timeframe
Multi-Level Candle Bias
Tracker
Auto Support and
Resistance Trend Lines
All Support and
Resistance Levels
Riepilogo
The system features smart color-coded trend detection by comparing fast, medium, and trend MAs, with candles changing color to indicate market phases: green for bullish, red for bearish, and orange for consolidation or uncertainty. This visual aid helps identify trend strength, direction, and potential consolidation zones.
On the chart, the main trend line changes color based on market direction, the dotted channel reflects volatility-based range, and colored bars provide an easy visual representation of the current market phase.
The indicator is fully customizable to fit different trading strategies. It aims to quickly identify trending or ranging markets, anticipate potential reversals with breakout and crossover signals, and confirm entry and exit points to reduce false signals and improve trade accuracy.
Recensioni dei clienti
5 | 33 % | |
4 | 67 % | |
3 | 0 % | |
2 | 0 % | |
1 | 0 % |


![Logo di "[CB] Pivot Points Pro"](https://cdn.ctrader.com/image/webp/43463c82-67b0-4f10-a4ba-901bba091d81_32594)


